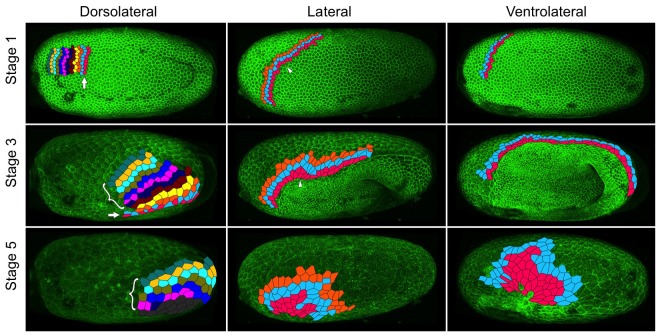
Figure 8. Serosal cells undergo intercalation during serosal expansion.
Stills from confocal live imaging of wildtype embryos with cell membranes marked via transient expression of GAP43-YFP. The tracked cells are colored as rows parallel to the serosa/germ rudiment boundary (pink closest to the boundary). The arrow indicates the region where cells intercalate to increase the number of cells at the serosa/germ rudiment boundary during stages 1–3. The arrowhead indicates one example region where cells intercalate to leave the serosa/germ rudiment boundary during stages 1–3. The bracket indicates cells located away from the serosa/germ rudiment boundary that undergo intercalation during stages 1–5. The dark gray cells in the lower left panel went out of the frame of view and could not be tracked for the full movie. In the right panels, new cells were tracked from when they became visible halfway through embryo formation (middle panel). Cell outlines were manually drawn using projection views of individual timepoints and individual z-sections. All panels show maximum intensity projections of one egg hemisphere. Anterior is left, ventral is down.

