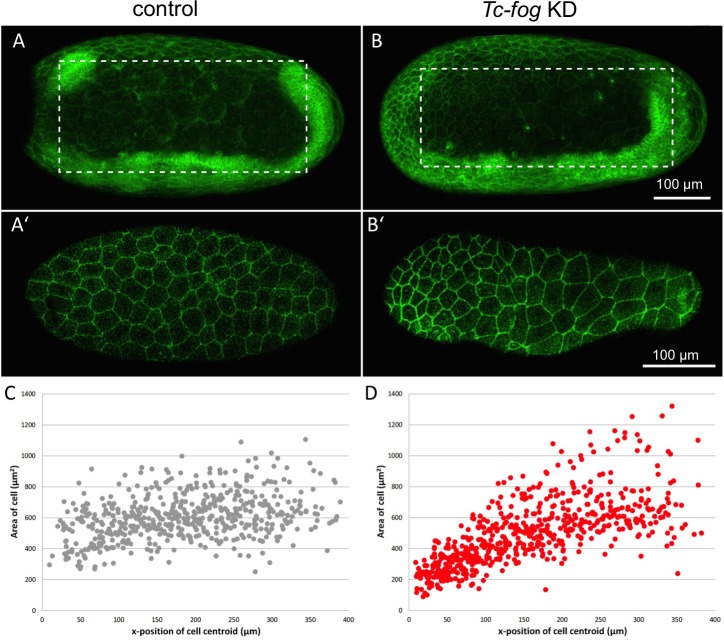
Figure 9. Fog signaling affects serosal expansion.
(A, B) Stills from confocal live imaging of wildtype (A) and Tc-fog eRNAi (B) embryos with cell membranes marked via transient expression of GAP43-YFP. Embryos are undergoing germband elongation. (A’, B’) Single optical section of the serosa from the dashed box region in (A, B) showing cells whose areas were measured. Quantification was performed on single optical section to avoid artefacts caused by curvature of the egg. (C, D) scatter plots showing serosa cell areas (wildtype (gray): 535 cells across eight embryos, Tc-fog eRNAi (red): 578 cells across seven embryos) together with AP position of cell centroids. Measurements were performed manually. (A, B) are average intensity projections of one egg hemisphere. Anterior is left, ventral is down.

