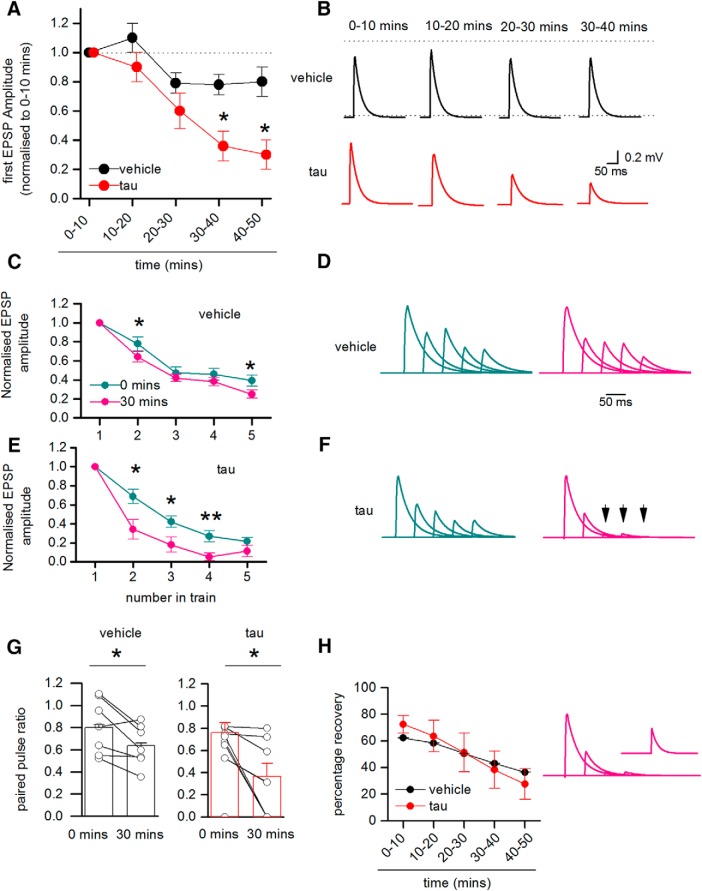
Figure 7.
Presynaptic oTau impairs synaptic transmission between Layer V PCs. A, The amplitude of the 1st EPSP in the train (relative to the amplitude of averaged EPSPs over the first 10 min of the recording) plotted against time for synaptically connected pairs with either vehicle or oTau (666 nM) introduced into the presynaptic cell. There was little change in the amplitude of EPSPs for connections where vehicle was introduced into presynaptic and postsynaptic cells (over 50 min), but there was a significant decline in the amplitude of EPSPs when oTau was introduced into the presynaptic cell (control vs tau 30–40 min p = 0.0293, 40–50 min p = 0.0344). B, Example of averaged 1st EPSPs at different time points when either vehicle or oTau was introduced into the presynaptic cell. The EPSPs are averages of 30–50 sweeps and have been deconvolved, cropped and then reconvolved (as outlined in Fig. 6). C, Graph plotting the amplitude of average EPSPs (relative to the amplitude of the 1st EPSP) against number in the train for 0–10 min of recording and for 30–40 min of recording, where vehicle was introduced into both presynaptic and postsynaptic cells. There was a small but significant increase in depression between time 0 and 30–40 min for the 2nd EPSP (p = 0.0316) and the 5th EPSP (p = 0.0409) in the train. D, Example EPSP waveforms from a single recording when vehicle was introduced into both the presynaptic and postsynaptic cells. Averages were constructed at 0–10 min (left panel) and at 30–40 min (right panel) and are normalized so the amplitude of the 1st EPSP remains the same. There is little change in the degree of depression over time. E, Graph plotting the average relative amplitude of EPSPs (relative to the 1st EPSP) against number in the train at 0–10 min and at 30–40 min with oTau present in the presynaptic cell. There was a significant increase in depression between 0 and 30–40 min for the 2nd EPSP 2 (p = 0.0347), 3rd EPSP (p = 0.0365), and 4th EPSP (p = 0.00941) in the train. F, Example EPSP waveforms from a single recording when oTau was introduced into the presynaptic cell. Averages were constructed at 0–10 min (left panel) and at 30–40 min (right panel) and are normalized so the amplitude of the 1st EPSP remains the same. The 3rd to 5th EPSPs (arrows) are absent in the 30- to 40-min average although the action potentials did not fail in the presynaptic cell. G, Graphs plotting paired pulse ratio (amplitude of 2nd EPSP/amplitude of 1st EPSP) for cells with vehicle present and for recordings when oTau was introduced into the presynaptic cell. The points are means from single experiments and the bars show the mean and SEMs for all recordings. In both treatments there was a significant fall in the paired-pulse ratio over the duration of the recording (vehicle p = 0.0316 and oTau p = 0.0347). H, Graph plotting the percentage recovery in EPSP amplitude measured by evoking an EPSP 1 s after the end of the train. If there was 100% recovery, then the recovery EPSP has the same amplitude as the 1st EPSP. The amount of recovery decreases over time and is similar for cells with either vehicle or oTau introduction. Right panel, Waveforms after 30–40 min (same recording as in F) showing the absence of the 3rd to 5th EPSPs, but there is some recovery in transmission after a 1-s interval (inset shows mean recovery EPSP). *P < 0.05, **P < 0.01.Figure Contributions: Emily Hill performed the experiments and analyzed the data.

