
Figure 2. Post-reward delay foraging and intertemporal choice behavior.
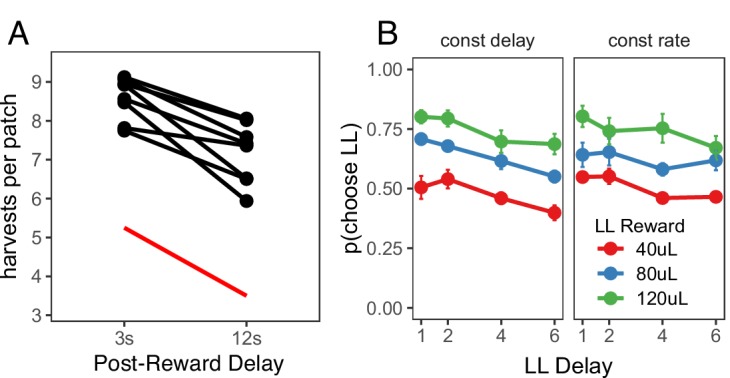
(A) Rat behavior in the Post-Reward Delay Experiment. Points and lines represent behavior of individual rats. Red line indicates optimal behavior (per MVT). (B) Rat behavior in the intertemporal choice task. Points and error bars represent mean ± standard error for each condition.
Figure 2—source data 1. Trial-by-trial intertemporal choice behavior.
elife-48429-fig2-data1.csv (6.4MB, csv)
DOI: 10.7554/eLife.48429.008