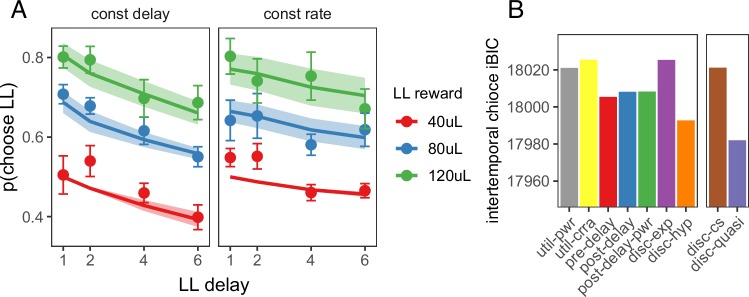
Figure 4. Model predictions for the intertemporal choice task.
(A) Quasi-hyperbolic model predictions for the intertemporal choice task. Points and error bars represent the mean ± standard error of individual rat behavior; lines and ribbon represent mean ± standard error of model predicted behavior for each individual rat. (B) The iBIC score for each model for the delay discounting experiment. Util-pwr and util-crra = nonlinear reward utility with power and CRRA function respectively, pre-del = linear overestimation of pre-reward delays, post-del = linear underestimation of post-reward delays, post-del-pwr=underestimation of post-reward delays according to a power function, disc-exp = exponential discounting, disc-hyp = hyperbolic discounting, disc-cs = constant sensitivity discounting, disc-quasi = quasi hyperbolic discounting.


