
Figure 4. Cell-specific disruption of per or tim in Pdf+ neurons causes incomplete loss of behavioral rhythmicity and loss of morning anticipation in constant darkness.
(A) Diagram showing Pdf+ circadian neurons. (B) CRISPR-mediated disruption of per or tim in Pdf+ neurons using the Pdf-Gal4 driver caused incomplete loss of behavioral rhythmicity. (C) Scatter plot showing the period of rhythmic flies with Pdf-Gal4-driven disruption of acp, per, or tim. (D) Actograms showing average activity of flies in constant darkness with Pdf-Gal4-driven disruption of acp, per, or tim. Nine days of activity are displayed, double-plotted. Dark gray rectangles = subjective day, black rectangles = subjective night. (E) Average hourly activity counts during the second day of complete darkness (DD Day 2; gray bars = CT 0–11, black bars = CT 12–23). Mean number of beam breaks per hour is shown ± SEM. (F) Morning Anticipation Index (MAI) was calculated by dividing the average hourly activity for CT 21–23 by the average hourly activity for CT 18–23. (G) Evening Anticipation Index (EAI) was calculated by dividing the average hourly activity for CT 9–11 by the average hourly activity for CT 6–11. For scatter plots, each point represents an individual fly and mean ± SEM is shown; ***: p<0.001; ****: p<0.0001; n.s.: not significant, p>0.05. Significance determined by Kruskal-Wallis nonparametric ANOVA (to account for non-normality of samples) followed by Dunn’s multiple comparisons test; reported p-values are multiplicity adjusted to account for multiple comparisons.

Figure 4—figure supplement 1. Representative actograms for each phenotypic class.

Figure 4—figure supplement 2. Cell-specific disruption of per or tim in Pdf+ cells causes reduction in rhythm strength.
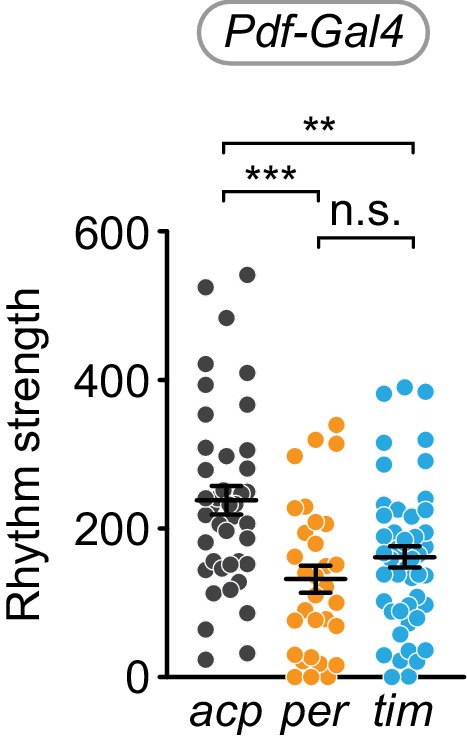
Figure 4—figure supplement 3. Average actograms for Pdf-Gal4 targeted flies under 12 hr:12 hr light:dark conditions.

Figure 4—figure supplement 4. Cell-specific disruption of per or tim in Pdf+ neurons causes loss of the morning anticipatory peak under constant conditions.
