. 2019 Oct 15;8:e48339. doi: 10.7554/eLife.48339

Figure 5. A bespoke system for ectopic TRIM21 expression at endogenous levels.

(A) Map of lentivector containing the endogenous 2 kb upstream promoter sequence of the human TRIM21 gene followed by the 5’UTR (Exons 1–2) and TRIM21 coding sequence (Exons 2–7). (B) Immunoblot of TRIM21 and COX IV (loading control) in WT, TRIM21 KO (KO) or lentivector reconstituted (Reconst.) 293Ts with or without interferon-alpha (IFN-α) pre-treatment. (C) Histograms of mCherry fluorescence intensity in cells transduced with lentivector encoding mCherry-TRIM21 driven by SFFV (Viral; Orange) or native TRIM21 promoter (Blue). Untransduced TRIM21 KO 293Ts were used as negative control (Red). (D) Immunoblot of TRIM21 and COX IV (loading control) in lentivector reconstituted 239Ts expressing the indicated TRIM21 variant, with the variants grouped into their host domains.

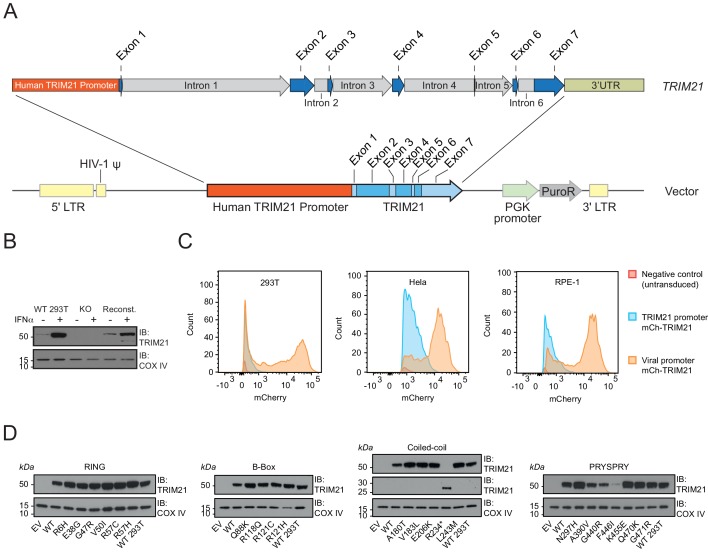
Figure 5—source data 1.
DOI: 10.7554/eLife.48339.014

Figure 5.

Figure 5—figure supplement 1. TRIM21 expression levels in reconstituted cell lines.

Figure 5—figure supplement 1.

(A–C) Immunoblot of TRIM21 and COX IV (loading control) in TRIM21 KO (KO), WT or native promoter lentivector reconstituted (Reconst.) cell lines (A) 293T, (B) Hela, (C) hTERT-RPE-1. (D) Quantification of TRIM21 variant expression in reconstituted 293Ts (from Figure 5D) normalized to wild-type expression level. (E) Correlation between intrinsic stability (Tm) and cellular expression levels of PRYSPRY variants using linear regression analysis in GraphPad Prism7 (R2 = 0.72). Data provided in Figure 5—source data 1.

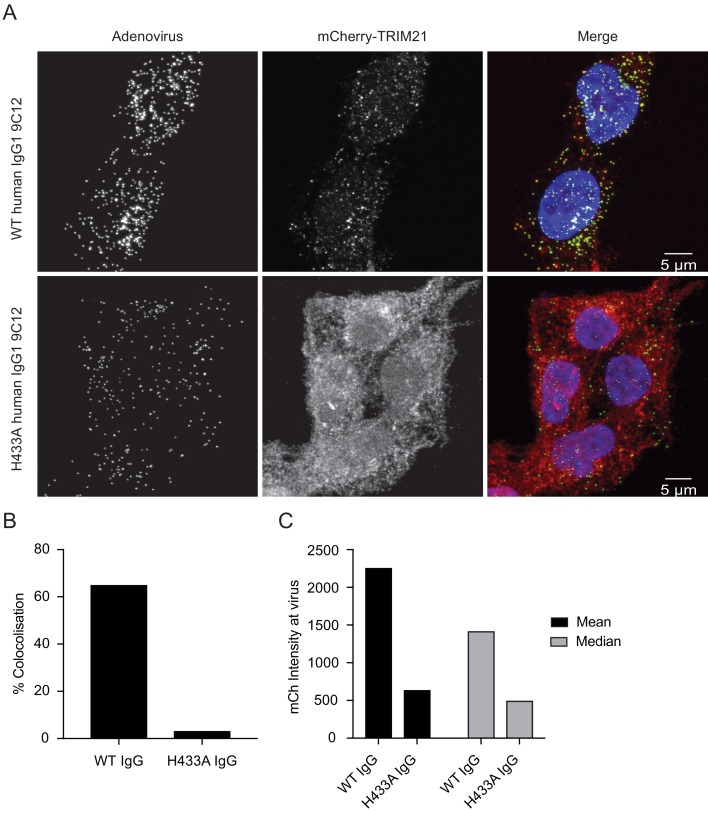
Figure 5—figure supplement 2. Native promoter driven mCherry-TRIM21 colocalizes with antibody coated AdV5.

Figure 5—figure supplement 2.

(A) Confocal microscopy images staining for human IgG and mCherry in TRIM21 KO 293Ts reconstituted with mCherry-TRIM21 driven by the native TRIM21 promoter. The cells were fixed 30 min after infection by AdV5 coated with either WT 9C12 or 9C12 with the H433A mutation in its Fc. (B) Quantification of colocalization between 9C12-AdV5 and mCherry-TRIM21 using the ComDet plugin in Fiji (Schindelin et al., 2012). (C) Quantification of the mean and median mCherry intensities at 9C12-AdV5 spots using the ComDet plugin in Fiji (Schindelin et al., 2012). Data provided in Figure 5—source data 1.