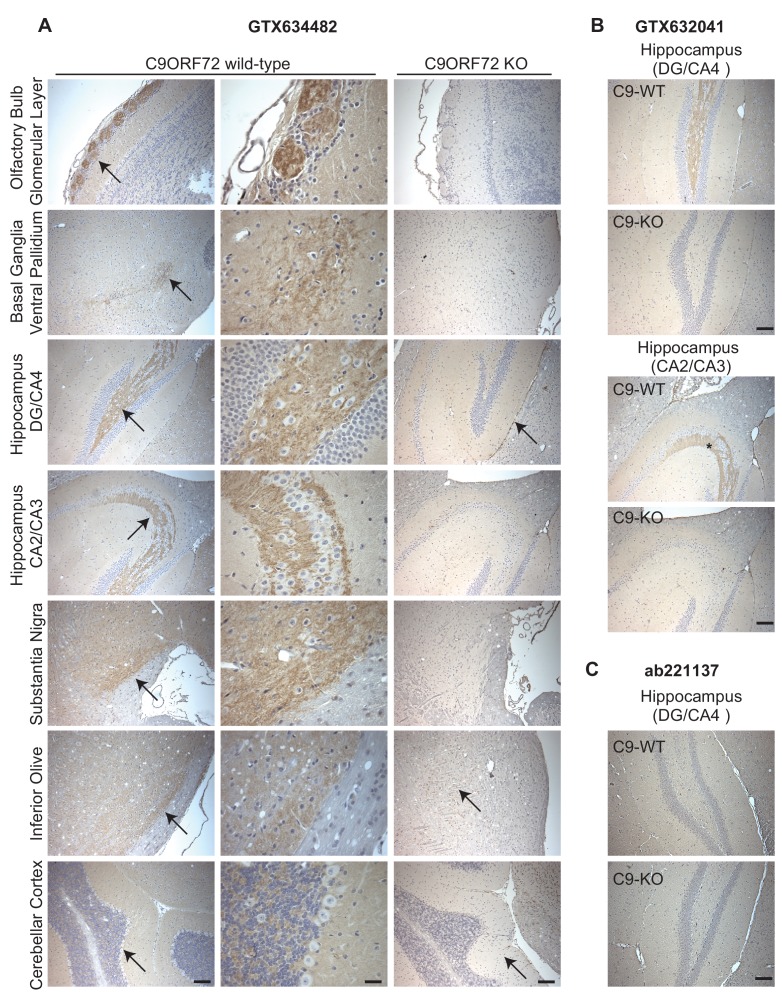
Figure 5. Analysis of C9ORF72 antibodies by immunohistochemistry.
(A) DAB immunohistochemistry of C9ORF72 WT and C9ORF72 KO mouse brains in the sagittal plane using C9ORF72 antibody GTX634482. Micrographs are ordered from the rostral to caudal aspect of the mouse brain. For C9ORF72 WT, arrows indicate areas of increased DAB labeling intensity and correspond to the inset regions in the middle column of images. For C9ORF72 KO (right most column), arrows indicate areas of non-specific labeling. Scale bars = 100 µm or 25 µm for the inset images on the right for the C9ORF72 WT micrographs). (B) DAB immunohistochemistry of C9ORF72 WT and C9ORF72 KO mouse brains in the sagittal plane of the indicated brain regions using C9ORF72 antibody GTX632041. Scale bars = 100 µm. (C) DAB immunohistochemistry of C9ORF72 WT and C9ORF72 KO mouse brains in the sagittal plane of the indicated region using C9ORF72 antibody ab221137. Scale bar = 100 µm.

