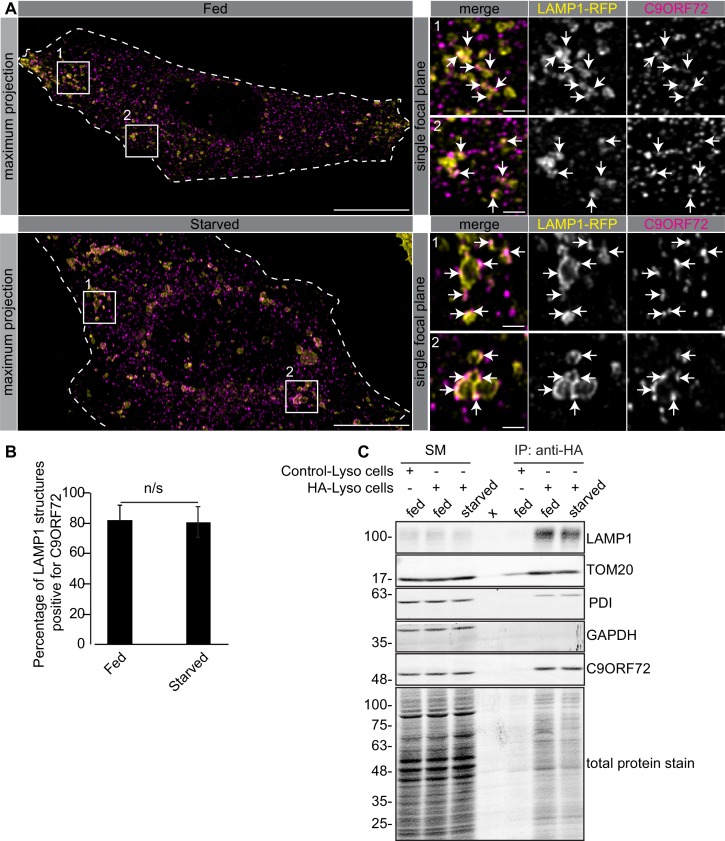
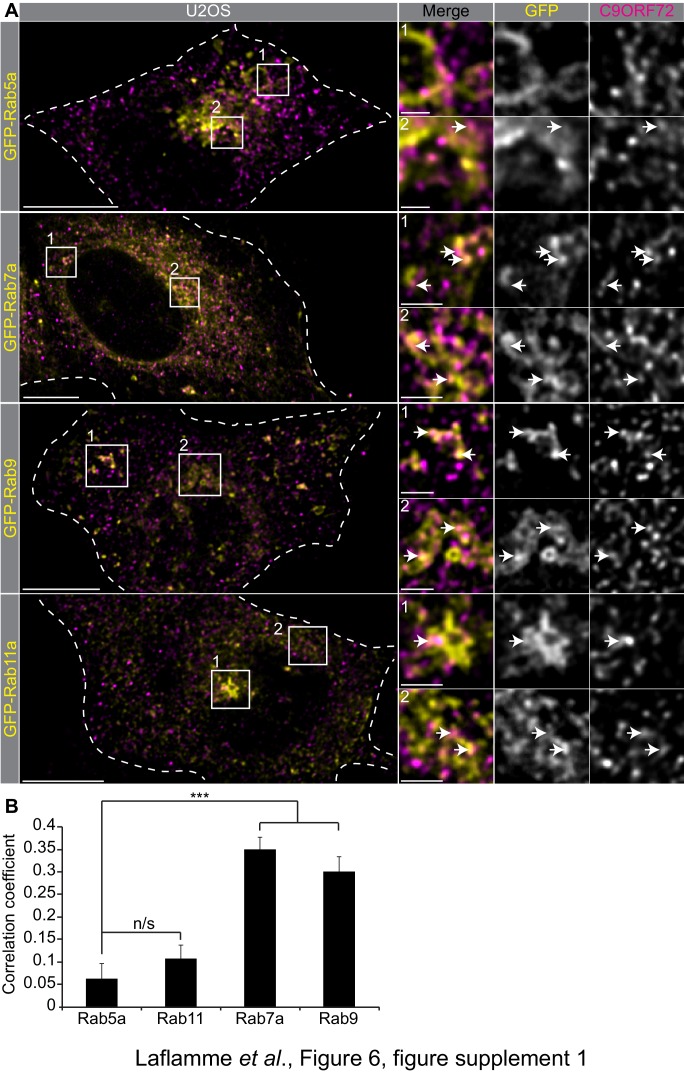
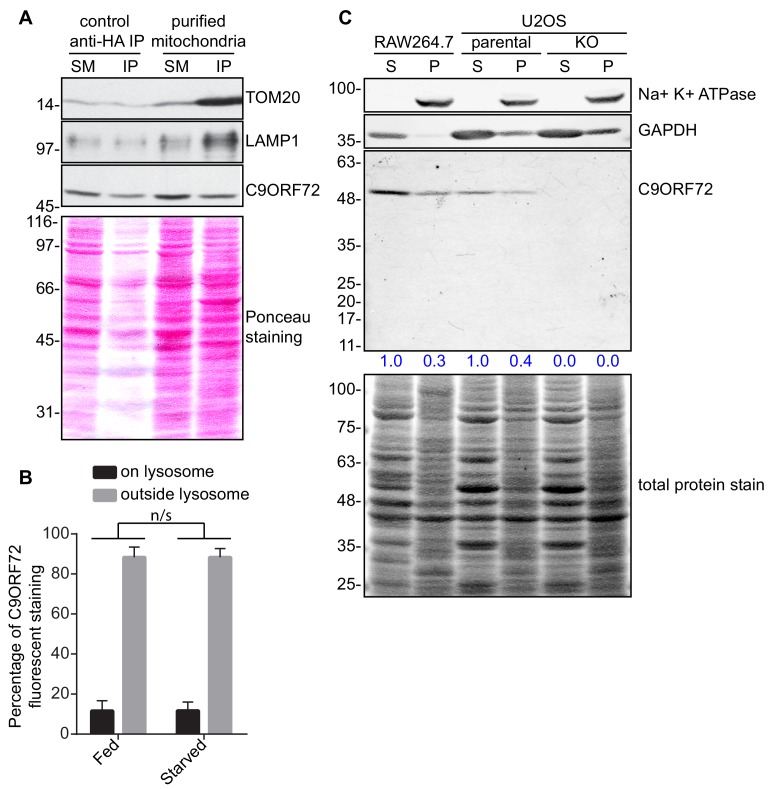
Figure 6. C9ORF72 localizes to lysosomes.
(A) Immunofluorescence of endogenous C9ORF72 stained with GTX632041 in U2OS cells expressing LAMP1-RFP. The large images on the left show a maximum projection to highlight intracellular structures. Insets 1 and 2 are single focal plane, higher magnification images of the boxed regions. Merge and grayscale images of C9ORF72 and LAMP1-RFP are shown. C9ORF72 localization was observed under basal conditions (top panels) or under starvation for 2 hr (bottom panels). Cells are outlined with white dashed lines. Scale bars = 20 µm for large images and 2 µm for insets. (B) Quantification of LAMP1 structures positive for C9ORF72 in basal growing condition (fed) or 2 hr starved condition (starved) in U2OS cells. Between 228–262 lysosomes were counted from at least nine different cells from three independent experiments. A Student’s t-test reveals that the percentage of LAMP1 structures positive for C9ORF72 is not significantly different between the fed and starved conditions (C) Lysates were prepared from HEK-293 cells expressing the Tmem192-3xHA (HA-Lyso cells) or the Tmem192-2xFlag (Control-Lyso cells). Lysosomes were immunoprecipitated using anti-HA magnetic beads. Quantitative immunoblotting for the indicated proteins was performed for starting material (SM), purified lysosomes and control immunoprecipitates (anti-HA IP). C9ORF72 was detected using GTX634482.


