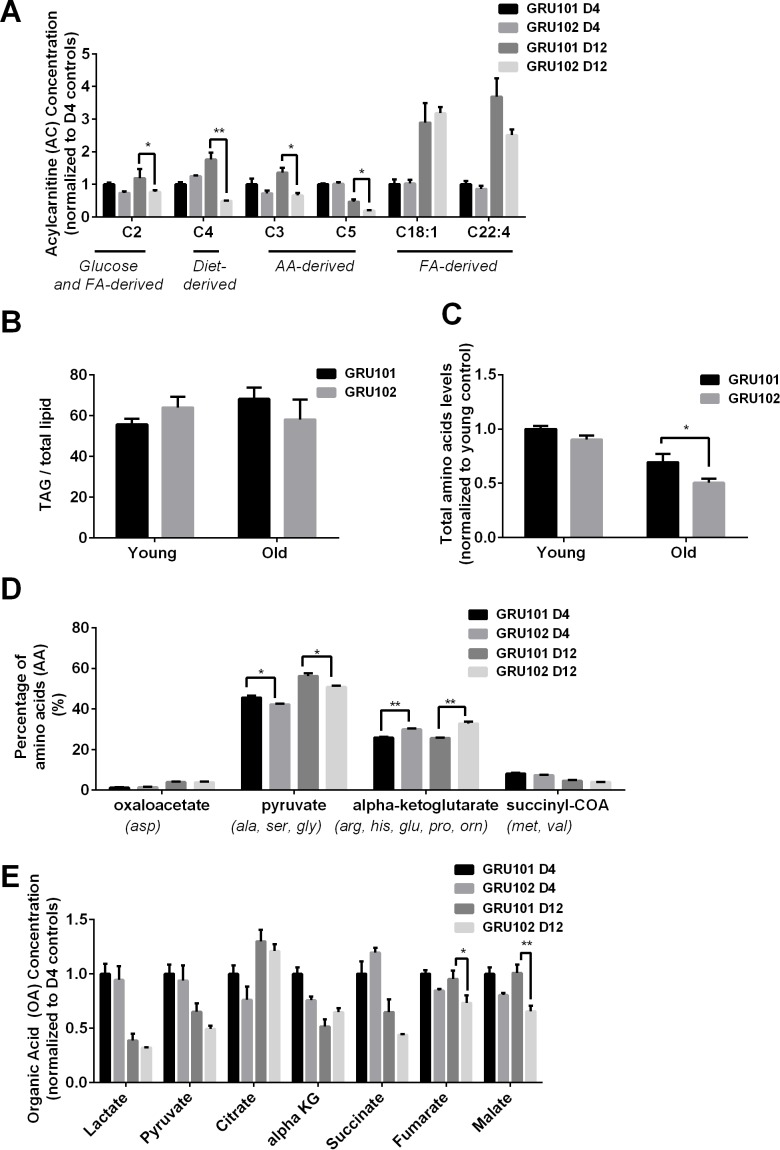
Figure 1. Metabolomics profile of GRU102 and its transgenic controls (GRU101).
(A) Acylcarnitines (AC) profile, (B) Triacylglyceride (TAG), (C) Total Amino acids (AA) level, (D) Percentage glucogenic AA, computed as [sum of AA forming the particular glucogenic substrate/total AA levels]. (E) Organic acids (OA) concentration of GRU101 and GRU102. All values were normalized to respective protein concentration and then to young GRU101 (Two-way ANOVA Dunnett’s multiple comparisons test, p<0.05, *; p<0.005, **; p<0.001, ***; n = 3 repeats per condition, with approximately 3000 animals per repeat collected from independent cohort). Similar results have been confirmed in one other independent trial (Figure 1—figure supplement 1).


