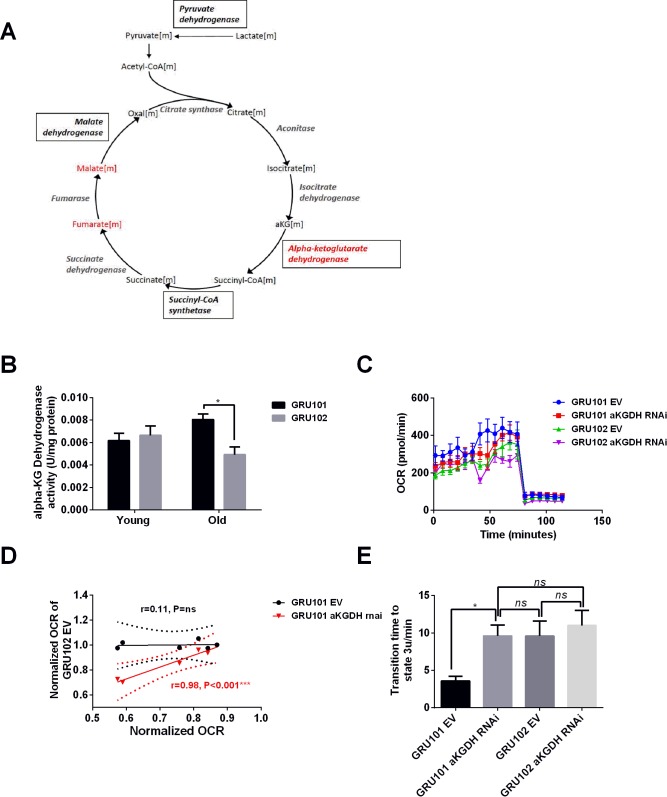
Figure 3. aKGDH knockdown recapitulated metabolic detriments of GRU102.
(A) Diagram illustrating changes in key enzymes and metabolites involved in the TCA cycle. (B) alpha-KG dehydrogenase activity in GRU102 and GRU101 controls (Two-way ANOVA Dunnett’s multiple comparisons test, p<0.05, *; n = 4–8 repeats per condition, with approximately 1500 animals collected from independent cohorts). (C) Oxygen consumption rate (OCR) profiles comparing GRU101 and GRU102 fed with aKGDH RNAi or EV (n = 6 repeats per group, with 10 animals per repeat). (D) Scatter plot illustrating high degree of correlation in OCR timecourse of GRU102 and GRU101 fed with aKGDH RNAi. OCR values were normalized to average uncoupled values of GRU101 (n = 6 measurements for each condition). (E) Time taken to reach fully uncoupled respiration (state 3 u) after addition of chemical uncoupler, defined as OCR rising to a value of two standard deviation (SD) above average coupled/basal OCR (n = 6 repeats per group, with 10 animals per repeat, One-way ANOVA Sidak’s multiple comparison, p<0.05, *).


