. 2019 Oct 15;8:e50069. doi: 10.7554/eLife.50069

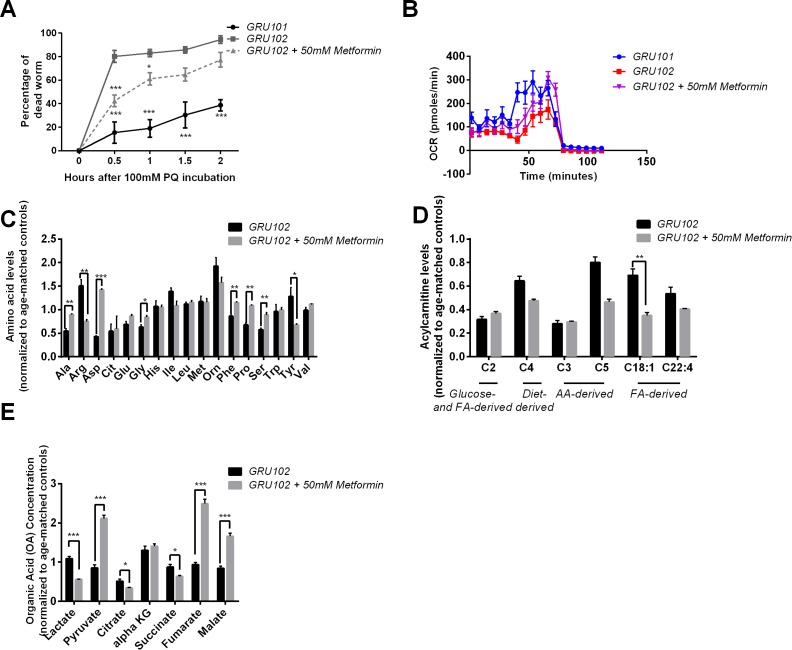
Figure 5. Effects of Metformin on Aβ-induced pathology in GRU102.

(A) Survival analysis of GRU102 animals treated with Metformin. At a dose of 50 mM, Metformin treatment significantly improved the lifespan of GRU102 (log-rank test p<0.005; n = 70–100 animals per condition). Similar result has been confirmed in two other independent trials (Supplementary file 3). (B) Time course of the percentage of dead animals observed as a function of time following treatment with 100 mM Paraquat (PQ). Metformin treatment improved PQ-stress resistance of GRU102 (Two-way ANOVA Dunnett’s multiple comparison, p<0.05, *; p<0.001, ***; n = 4 repeats per condition, with 10–20 animals per repeat). Similar result has been confirmed in one other independent trial. (C) Metabolic flux profile of Metformin-treated GRU102 (n = 6 repeats per condition, with 10 animals per repeat). Similar result has been confirmed in two other independent trials. (D) Amino acid, (E) Acylcarnitine, (F) Organic acid profile of Metformin-treated GRU102 on day 12. All values were normalized to respective protein level and then to age-matched GRU101 control (unpaired t-test, p<0.05, *; p<0.005, **; n = 3 repeats per condition with approximately 3000 animals per repeat collected in three independent cohorts). Similar result has been confirmed in one other independent trial (Figure 5—figure supplement 1).

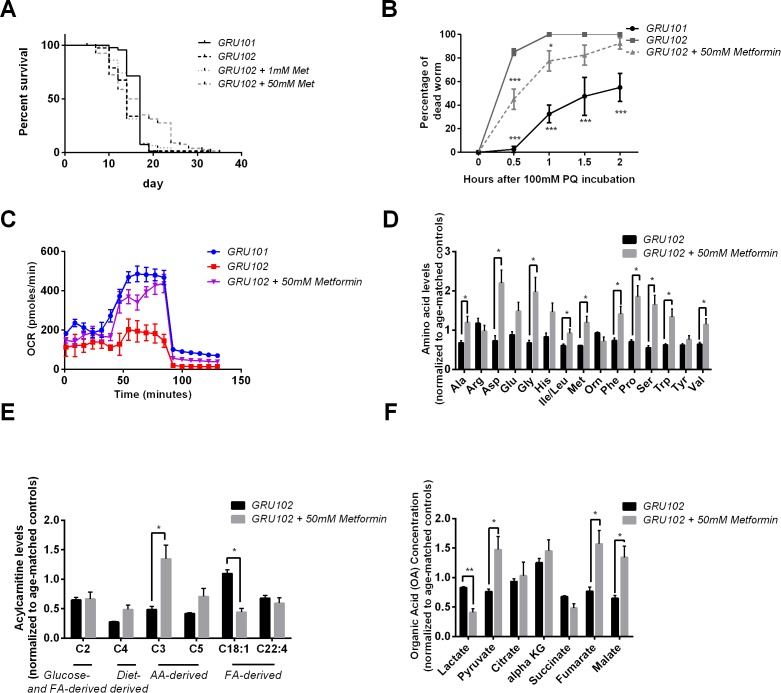
Figure 5—source data 1. Metabolomics data for D12 GRU102 and D12 GRU102 treated with Metformin.
All values were normalized to D12 GRU101.
DOI: 10.7554/eLife.50069.020
Figure 5—source data 2. Raw data for Seahorse oxygen consumption rate profile for D12 Metformin-treated GRU102.
DOI: 10.7554/eLife.50069.021

Figure 5.

Figure 5—figure supplement 1. Effects of Metformin on Aβ-induced pathology in GRU102 (Independent repeat).

Figure 5—figure supplement 1.

(A) Time course of the percentage of dead animals observed when treated with 100 mM Paraquat (PQ). Metformin treatment improved PQ-stress resistance of GRU102 (Two-way ANOVA Dunnett’s multiple comparison, p<0.05, *; p<0.001, ***; n = 4 repeats per condition, with 10–20 animals per repeat). (B) Metabolic flux profile of Metformin-treated GRU102 (n = 6 repeats per condition, with 10 animals per repeat). (C) Amino acid, (D) Acylcarnitine, (E) Organic acid profile of Metformin-treated GRU102 on day 12. All values were normalized to respective protein level and then to age-matched GRU101 control (unpaired t-test, p<0.05, *; p<0.005, **; n = 3 repeats per condition with approximately 3000 animals per repeat collected in three independent cohorts).
Figure 5—figure supplement 2. Metabolomics analysis of Metformin treatment.

Figure 5—figure supplement 2.

(A) Heatmap analysis of metabolomics data. Abbreviation: Isoleucine/Leucine (Ile/Leu), Methionine (Met), Tyrosine (Tyr), Isovaleryl Carnitine (C5), Tryptophan (Trp), Phenylalanine (Phe), Valine (Val), Glutaryl-L-Carnitine (C5-DC), Arginine (Arg), Butyryl Carnitine (C4), Hydroxyvaleryl-L-carnitine/Methylmalonyl L-carnitine (C5-OH/C3-DC), Ornithine (Orn), alpha-ketoglutarate (alpha KG), Histidine (His), Alanine (Ala), Glutamic acid (Glu), Octadecanoyl carnitine (C18:1), Octenoyl-L-carnitine/Hexenoyl-L-carnitine (C8:1-OH/C6:1-DC), Acetyl carnitine (C2), Fumaryl-L-carnitine/Hydroxyhexanoyl L-carnitine (C4-DC/C6-OH), Propionyl carnitine (C3), Aspartate (Asp), Glycine (Gly), Proline (Pro), Serine (Ser). Color key represents the scaled abundance of a given metabolite, where the mean abundance of a given metabolite across the entire dataset was calculated (centering) and all the samples values were standardized to z-score (scaled by the standard deviation). For example, the scaled abundance of Ser for D12 GRU102 + met 2 was approximately 3 times the standard deviation higher from the mean abundance of Ser level across the entire dataset. (B) Principal component analysis (PCA) of cluster one metabolites. (C) Levels of cluster one metabolites in D4 GRU101 and D4 GRU102 (unpaired t-test, p<0.05, *; p<0.005, **; n = 3 repeats per condition with approximately 3000 animals per repeat collected in three independent cohorts). (D) Levels of cluster one metabolites in D4 GRU102, D12 GRU102 and D12 GRU102 + Metformin (unpaired t-test, p<0.05, *; p<0.005, **; p<0.001, ***; n = 3 repeats per condition with approximately 3000 animals per repeat collected in three independent cohorts).
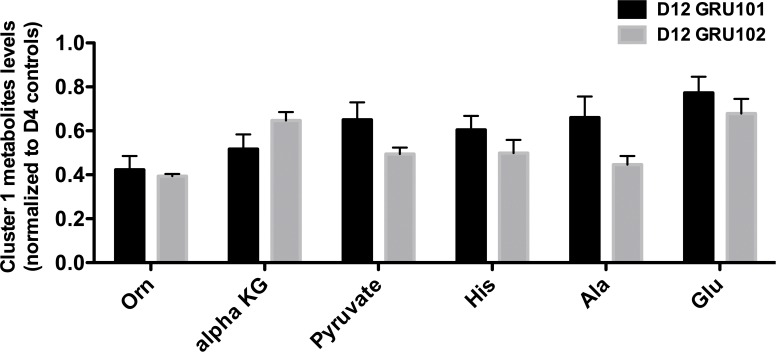
Figure 5—figure supplement 3. Levels of cluster one metabolites in old (day 12) animals.

Figure 5—figure supplement 3.

No significant differences were observed between genotype on day 12.
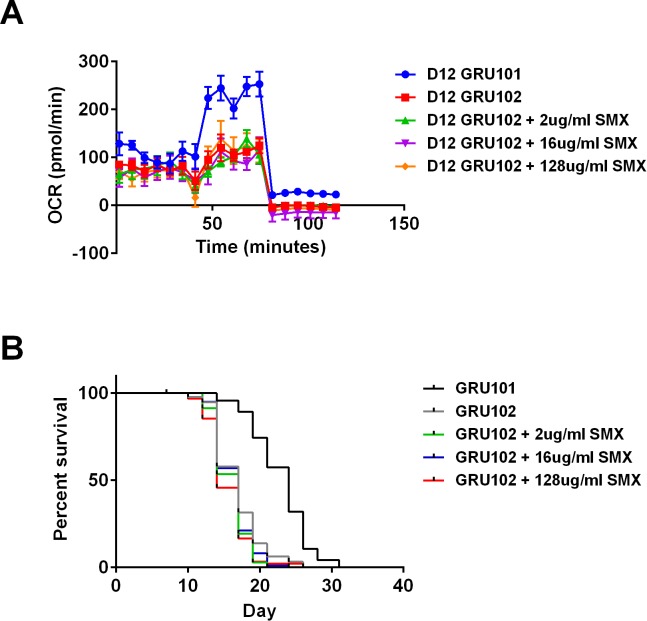
Figure 5—figure supplement 4. Sulfamethoxazole (SMX) did not rescue metabolic flux or lifespan detriments in GRU102.

Figure 5—figure supplement 4.

(A) Metabolic flux profile of Sulfamethoxazole (SMX)-treated GRU102 (n = 6 repeats per condition, with 10 animals per repeat). (B) Lifespan curves of SMX-treated GRU102 (n > 95 animals per group). No significant differences were observed between GRU102 and GRU102 treated with SMX at any concentration.