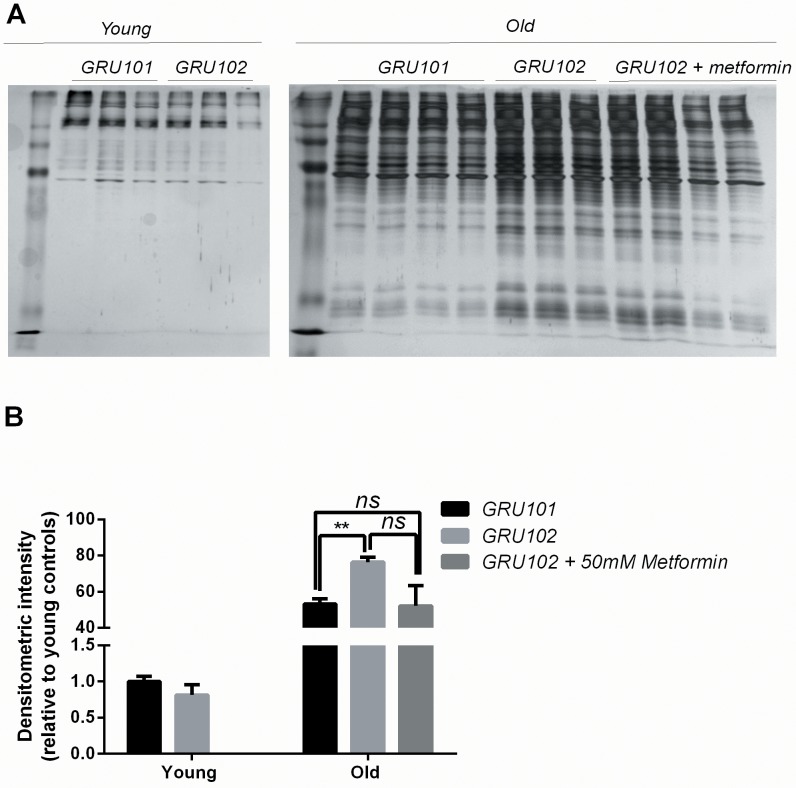
Figure 6. Levels of insoluble protein in GRU102.
(A) Silver stain of SDS-Page gel of detergent-insoluble protein, loaded based on five times the volume equivalent of 2 ug soluble protein determined by Bradford protein assay. (B) Silver stain of SDS-Page gel of 0.2 ug detergent-soluble protein determined by Bradford protein assay. (C) Normalized densitometric intensity corrected for differences in protein loading evaluated from soluble protein gel (Densitometric intensity of Gel A/Densitometric intensity of Gel B; Two-way ANOVA Dunnett’s multiple comparisons test, p<0.05, n = 3 repeats for all conditions, each repeat contains approximately 1500 animals collected in independent cohort). Similar result was observed in another independent repeat (Figure 6—figure supplement 1).


