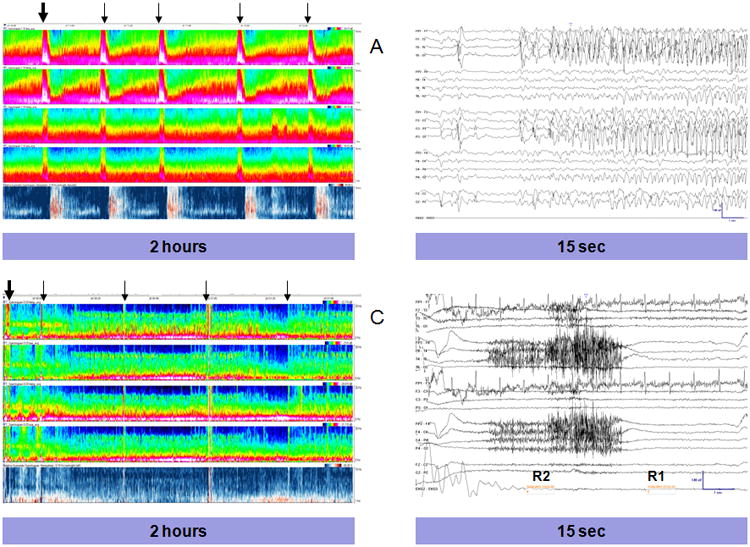
Figure 1. Seizures and Artifact in CSA Displays.

Compressed Spectral Array (CSA) displays, demonstrating a seizure (A) and muscle artifact (C). Each CSA displays 2 hours of EEG data. X-axis:time, Y-Axis:frequency (0-20Hz), Z axis: power with black representing lowest and white highest power. From top-to-bottom, the individual segments represent: left lateral power (Fp1-F7, F7-T3, T3-T5, T5-O1), left parasaggital power (Fp1-F3, F3-C3, C3-P3, P3-O1), right lateral power (Fp2-F8, F8-T4, T4-T6, T6-O2), right parasaggital power (Fp1-F4, F3-C4, C4-P4, P4-O2) and the relative asymmetry index. For the relative asymmetry index, red represents increased right-sided power and blue increased left-sided power. (A) Five seizures are present, marked by arrows (B) Section of the EEG corresponding to the EEG segment marked by the thick arrow, demonstrating seizure onset. (C) CSA display with several segments with muscle artifact, each marked by an arrow corresponding to where a CSA reviewer placed a mark. (D) Section of the EEG corresponding to the CSA segment marked by the thick arrow, displaying muscle artifact.
