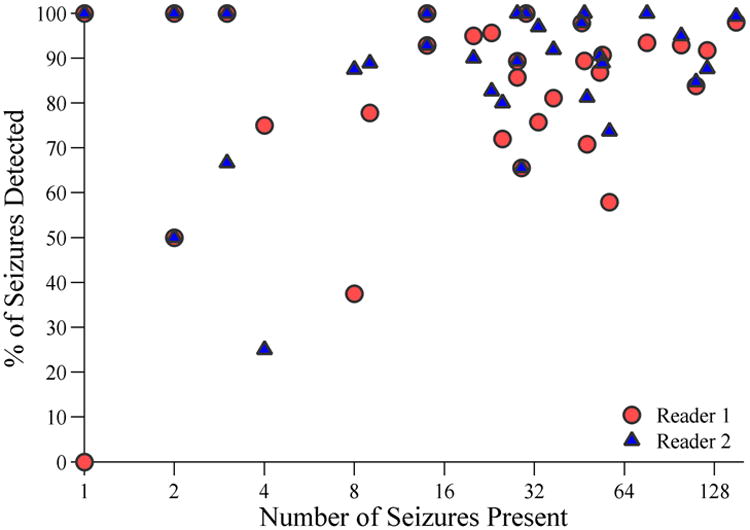
Figure 3. Sensitivity of CSA Screening for Seizures.

The sensitivity (% of seizures present which were detected) for each of the two CSA reviewers is displayed on the y-axis vs. the number of seizures present in each cEEG recording (x-axis). The number of seizures is displayed on a logarithmic scale in order to provide better visualization of each data point.
