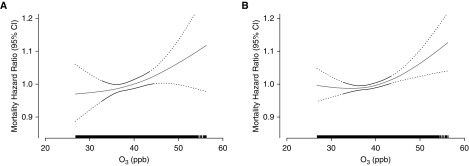
Figure 1.
Concentration–response curves (solid lines) and 95% confidence intervals (dashed lines) relative to the effect at mean concentration, based on natural spline models with 2 df, for standard Cox models adjusted for individual-level and contextual covariates; (A and B) respiratory disease mortality (A) and cardiovascular disease mortality (B). The tick marks on the x-axis identify the distribution of observations according to annual average ozone concentrations. CI = confidence interval; O3 = ozone.

