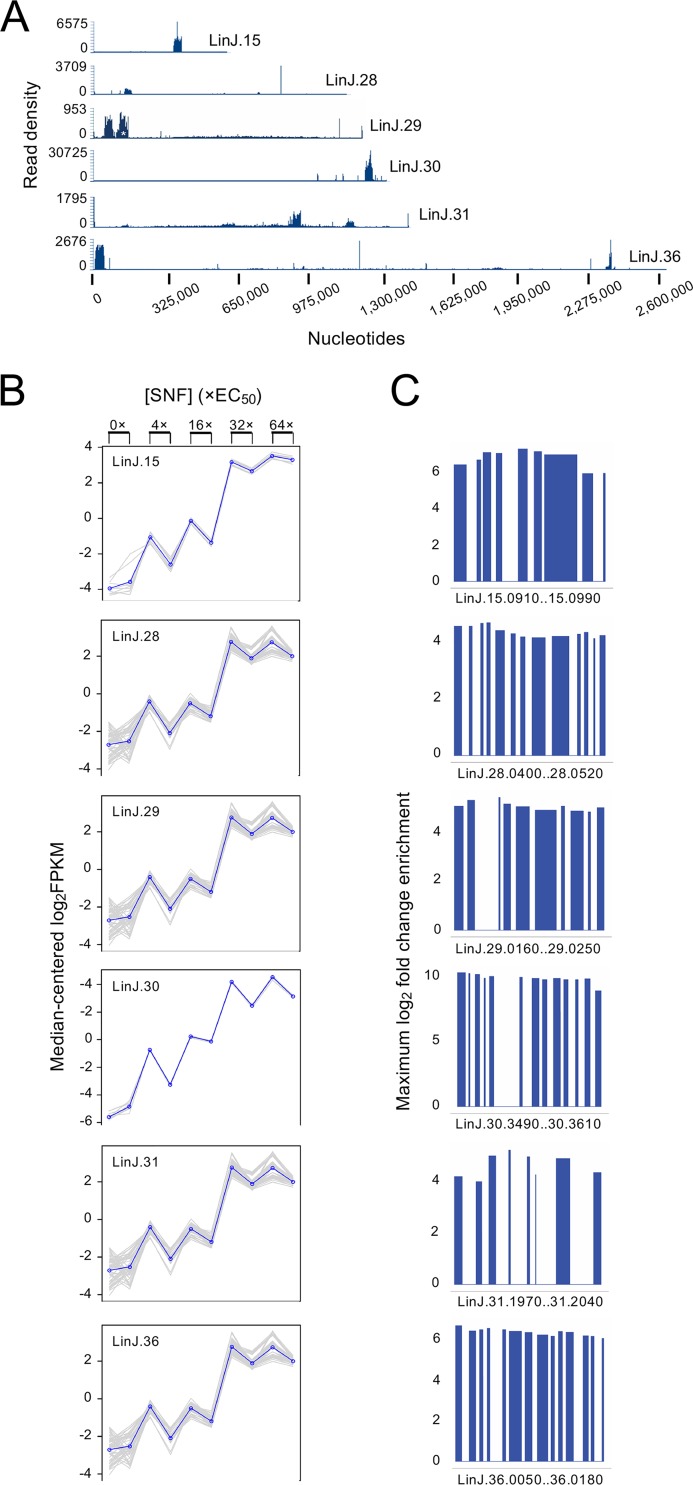
FIG 4.
Identification of SNF-responsive loci using a Cos-seq screen with SNF. (A) Visualization of five representative SNF-enriched loci on chromosomes 15, 28, 29, 30, 31, and 36 as delimited by regions of higher read density. A cosmid/region from chromosome 29 that was also enriched in untreated populations through passages is indicated by a white asterisk. (B) Plots of gene clusters sharing similar enrichment profiles. The plots include genes from the five representative SNF-enriched loci recovered by gradual SNF selection. Gray lines represent individual genes, and blue lines denote the average profile per cluster. Gene abundance is expressed on the y axis as log2 transformed fragments per kilobase of transcript per million mapped reads (FPKM) values centered on the median FPKM. Samples are ordered on the abscissa according to the selection procedure, from nontreated samples (0×) to the final drug increment (64× EC50). Gene abundance profiles for the two biological replicates are shown. “Staircase” patterns are due to differences in gene abundance at baseline between the replicates. (C) Maximal fold enrichment for genes from the five enriched cosmids depicted in panel A normalized to the drug-free control. In all cases, maximal enrichment occurred at SNF concentration equivalent to 64× EC50.

