
Figure 4.
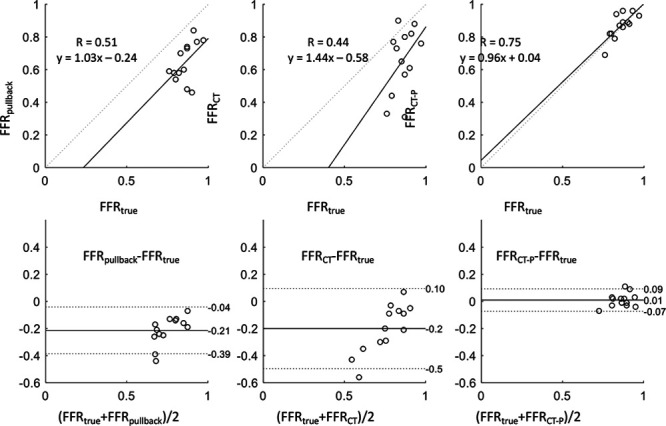
Scatter and Bland-Altman plots demonstrating how planner tool improves estimation of FFRtrue. Top, Scatterplots comparing the (left to right) FFRpullback, FFR by computed tomography (FFRCT), and FFRCT-derived percutaneous coronary intervention (PCI) planning tool (FFRCT-P) against true FFR. Solid lines represent the best linear fit to the data and dotted lines represents the line of identity (x=y). Bottom, Bland-Altman plot comparing the differences between FFRtrue and FFRpullback, FFRCT, and FFRCT-P (left to right). Solid line represents the mean difference, and dotted lines correspond to the 95% CIs. FFR indicates fractional flow reserve.