Figure.
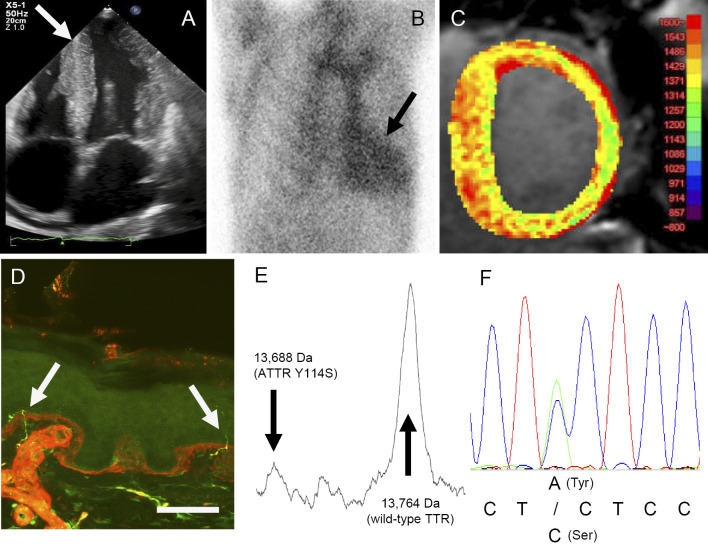
A: Echocardiography. The arrow indicates ventricular wall thickening and a granular sparkling pattern. B: 99mTc-pyrophosphate myocardial scintigraphy. The arrow indicates a site of 99mTc-pyrophosphate accumulation, which suggests amyloid deposition in the myocardium. C: Cardiac magnetic resonance image with non-contrast T1 mapping. A markedly elevated myocardial native T1 value was obtained. D: Anti-PGP9.5 antibody staining of a skin specimen: the intra-epidermal nerve fiber (arrows) density was reduced. Scale bar=50μm. E: A MALDI-TOF MS analysis detected the variant peak of ATTR Y114S in addition to a wild-type TTR peak. F: A genetic analysis of exon 4 in the TTR gene. One base pair substitution (c.401A>C, p. TTR Y114S) was found.

