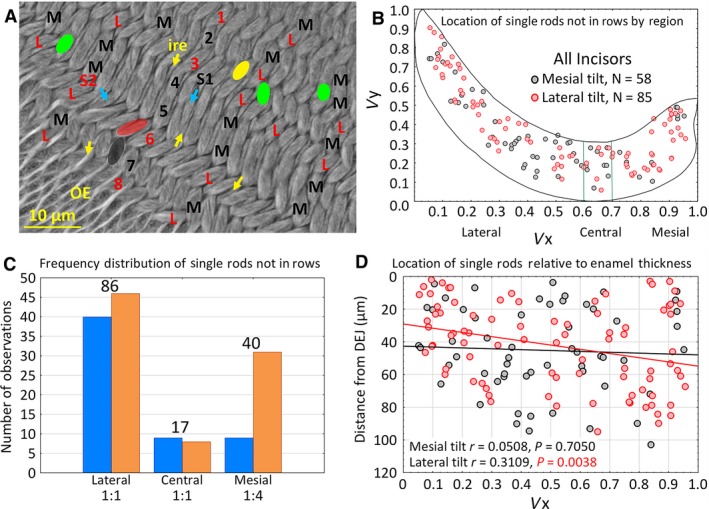
Figure 2.

Distribution of single enamel rods that could not be assigned to a specific row. In every transverse section examined in this investigation, there were always some instances where single enamel rods appeared out of alignment to neighboring rows. (A) Cropped area in the lateral region of the inner enamel layer showing rows of enamel rods having either mesial (black) or lateral (red) tilts. Many of the rows show uniform alternation of row tilts (e.g. 1‐2‐3‐4), but there are cases where two rows with the same tilt are paired with each other (e.g. rows 4‐5) and other irregularities where a row terminates (green, row endpoint for row with mesial tilt; yellow, row endpoint for row with lateral tilt) as well as cases where single enamel rods appear out of alignment with other neighboring enamel rods having similar tilt (black S1 with blue arrow for mesial tilt; red S2 with blue arrow for lateral tilt). Yellow arrows, sheets of interrod enamel; OE = outer enamel layer. (B) Scatter plot in virtual coordinates illustrating sites where out‐of‐alignment single enamel rods were found in the 24 incisors examined. (C) Bar graph showing the frequency of single enamel rods relative to rod tilt (blue = mesial, orange = lateral) and the three regions of the enamel layer. Numbers below regions indicate the ratio of mesial tilt to lateral tilt, numbers on top of the graph indicate total enamel rods irrespective of tilt. (D) Scatter plot with linear correlation lines for single rods relative to their x‐axis location and distance away from the DEJ (y‐axis) as measured in scaled montage maps. DEJ, dentinoenamel junction.
