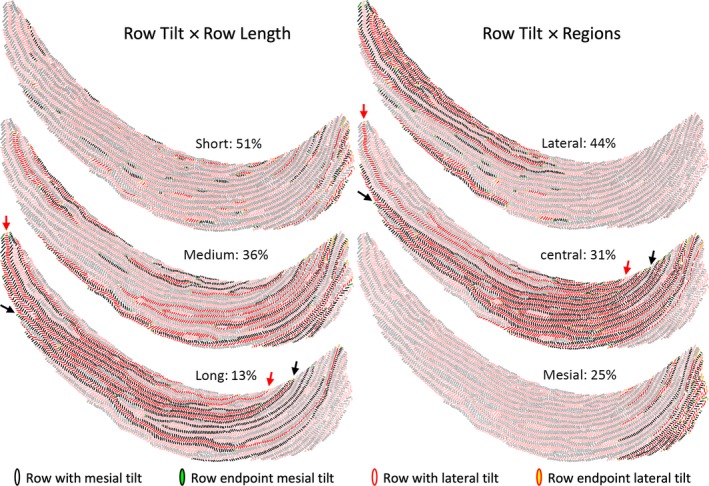
Figure 3.

Graphic representations of Fig. 1B illustrating the distribution of short, medium and long rows, and the distributions of rows in the lateral, central and mesial regions of the inner enamel layer. The criteria for classifying rows by length and region are shown in Table 1. The percentages in each category for all 24 incisors analyzed are indicated. The arrows point to the longest row having a mesial tilt (black) and a lateral tilt (red) found on this tooth.
