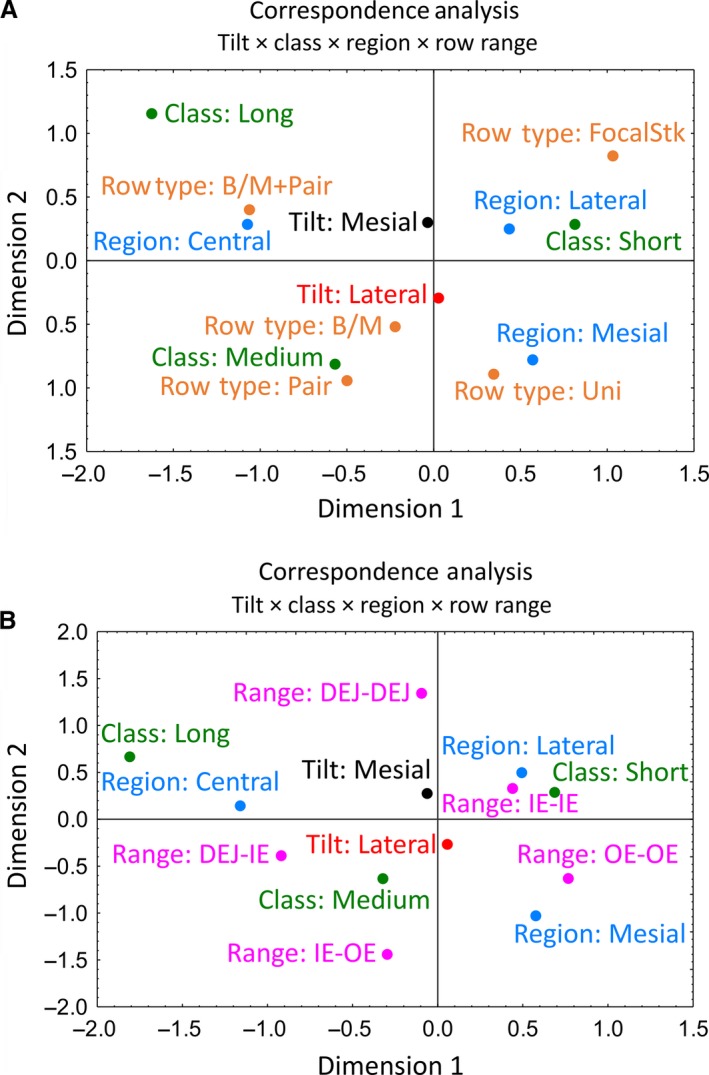
Figure 6.

Correspondence plots of 2D relationships between categorical variables for row tilt, row class (length), enamel layer region, row type (A) or row endpoint location (range, B). Row tilt, row class (length) and enamel layer region have similar interrelationships in the two plots. Row type and row range also show similar single factor distribution with one category in every quadrant and the second category in the southwest quadrant: paired and branching/merging rows in the case of (A), and DEJ‐IE and DEJ‐OE in the case of (B). B/M, branch/merge; DEJ, dentinoenamel junction; IE, inner enamel layer; OE, outer enamel layer; Stk, stack.
