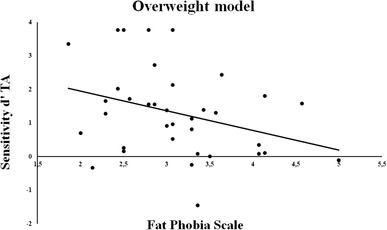
Fig. 5.

Multiple scatter plot of participants’ task sensitivity (d′) for the observation of True actions (TA) performed by overweight models vs. the Fat Phobia scale scores. A negative correlation indicates that participants with higher levels of fat phobia are worse at discriminating TA when performed by overweight models
