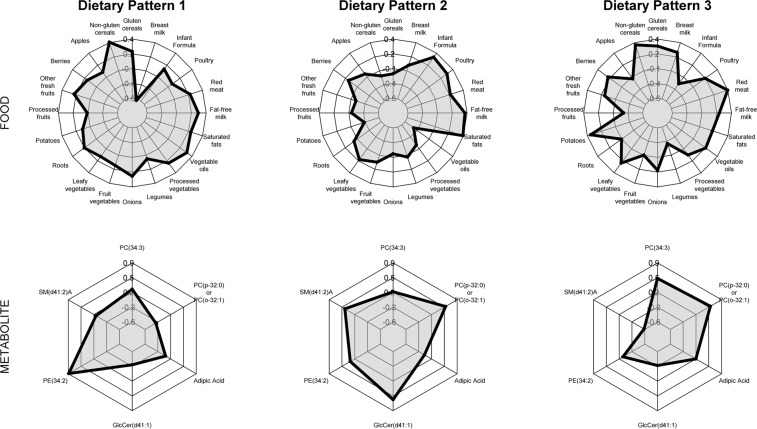
Figure 3.
Food group loadings and metabolite weights for metabolite-related dietary patterns. In total, the three dietary patterns explained 8% of metabolite variation and 29.3% of food variation. For food, the radial axis indicates the loading on each dietary pattern (Range: −0.6 to 0.4), and is used to interpret which combinations of foods are influential in the dietary pattern. Similarly, the metabolite radial axis indicates the weight of each metabolite on each dietary pattern (Range: −0.6 to 0.9), indicating which combination of metabolites are explained by each dietary pattern. For example, subjects scoring high on dietary pattern 1 had diets higher in non-gluten containing cereals, onions, vegetable oils, and fat-free milk, and lower in breast milk. This diet corresponded to higher levels of PE (34:2).

