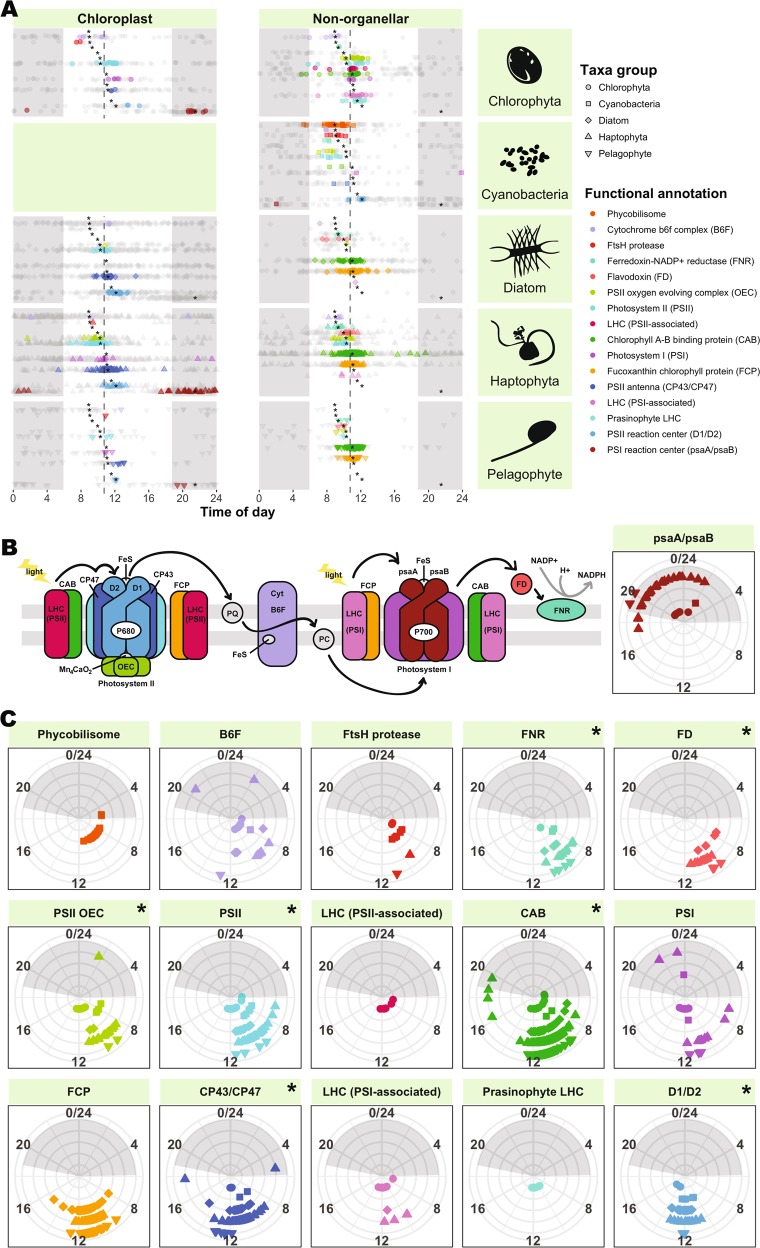
Fig. 5.
Peak expression time of large fraction ab initio ORFs involved in photosynthesis. Night is indicated by gray shading. a Cascade of peak expression time occurs across diverse phytoplankton lineages. ORFs are plotted by chloroplast encoded (left) and non-organellar (right). Significantly periodic ORFs (HRA; FDR ≤0.1) are colored by functional annotation (legend, right) and plotted in the same order as shown in the legend; insignificant ORFs are shown in grey. Asterisks denote functional annotation means across taxa groups that differ significantly (Watson–Wheeler Test of homogeneity of means, averaged over 1000 iterations to break ties, and Benjamini–Hochberg FDR <0.05) from the overall mean peak expression time (dashed gray line; 10:53 a.m.). b Illustration of the photosynthetic apparatus, colored by functional annotations from parts (a, c). Components with fewer than ten significantly periodic ORFs (pastoquinone (PQ), plastocyanin (PC)) are depicted in gray. Black arrows denote electron transport. c Conservation of peak expression time across phytoplankton lineages. Taxa groups are distinguished by shape (legend, top right) and radius (innermost: chlorophyta, outermost: pelagophyte). A Watson–Williams Test of homogeneity of means was performed on each functional group to determine taxonomic differences in peak expression time. Annotations with significantly different peak expression time across taxa groups (Benjamini–Hochberg FDR <0.05) are indicated with an asterisk

