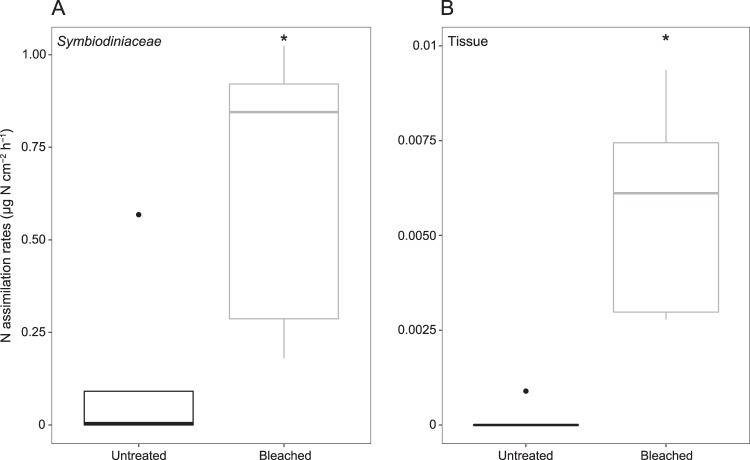
Fig. 1.
Nitrogen assimilation rates (µg N cm−2 h−1) in Symbiodiniaceae (a) and coral tissue (b) in untreated and bleached corals after 12 h of exposure to 15N2-enriched natural plankton assemblage (mean ± SD; n = 5 for each treatment). Horizontal line in each boxplot indicates the median and black dots represent the outlier samples. Asterisks indicate statistically significant differences

