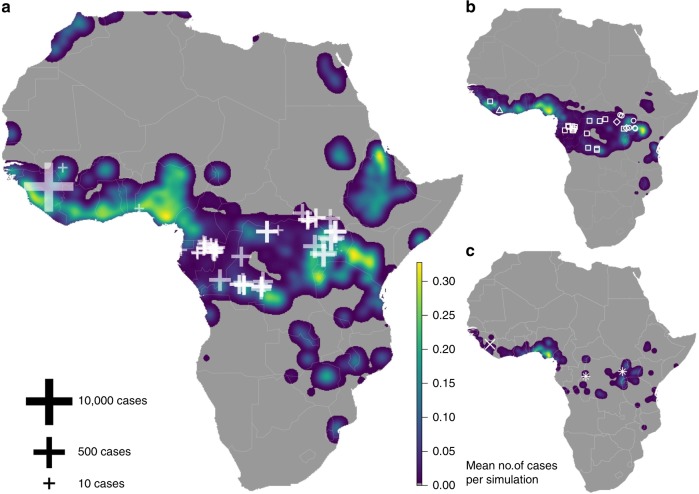
Fig. 3.
Present day risk of EVD cases caused by Zaire Ebola virus (EBOV) from EMM simulations. Maps represent the mean number of EVD-EBOV cases between zero (dark blue) and 0.3 (yellow) per grid cell (0.0416°—5.6 km at equator) across 2500, 365-day simulation runs for the present day, where (a) shows all cases (both index and secondary), (b) index cases only, and (c) index cases from epidemics (1500+ cases). White crosses in (a) represent log outbreak size. White symbols in (b) represent all locations of known EVD index cases from different viral strains, where circles represent Zaire (EBOV), square Sudan (SUDV), triangles Taï Forest (TAFV), and tetrahedrons Bundibugyo (BDBV). Diagonal white cross in (c) represents location of index case from 2014–2016 epidemics, white stars the locations of Ebola outbreaks that have occurred since the modelling was run

