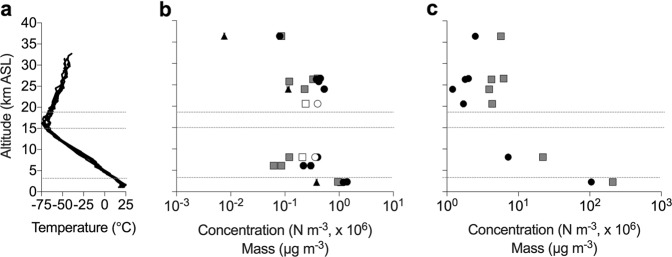
Fig. 1.
Temperature (a), microbiological (b), and particle (c) data with altitude. a Temperature profiles from Amarillo, TX were used to identify the CBL, free troposphere, tropopause, and stratosphere, the approximate boundaries of which are demarcated by the gray horizontal lines. b Cell (black circles) and cell carbon (gray squares) concentration estimates for the flights listed in Table 1. The values for “viable” cells (black triangles) were derived from the ATP data (Table S4). Open symbols are samples that did not exceed the procedural limits of detection. c Particle concentration (black circles) and mass (gray squares) for each flight in Table 1. Error values are obscured by symbols and provided in Table 1

