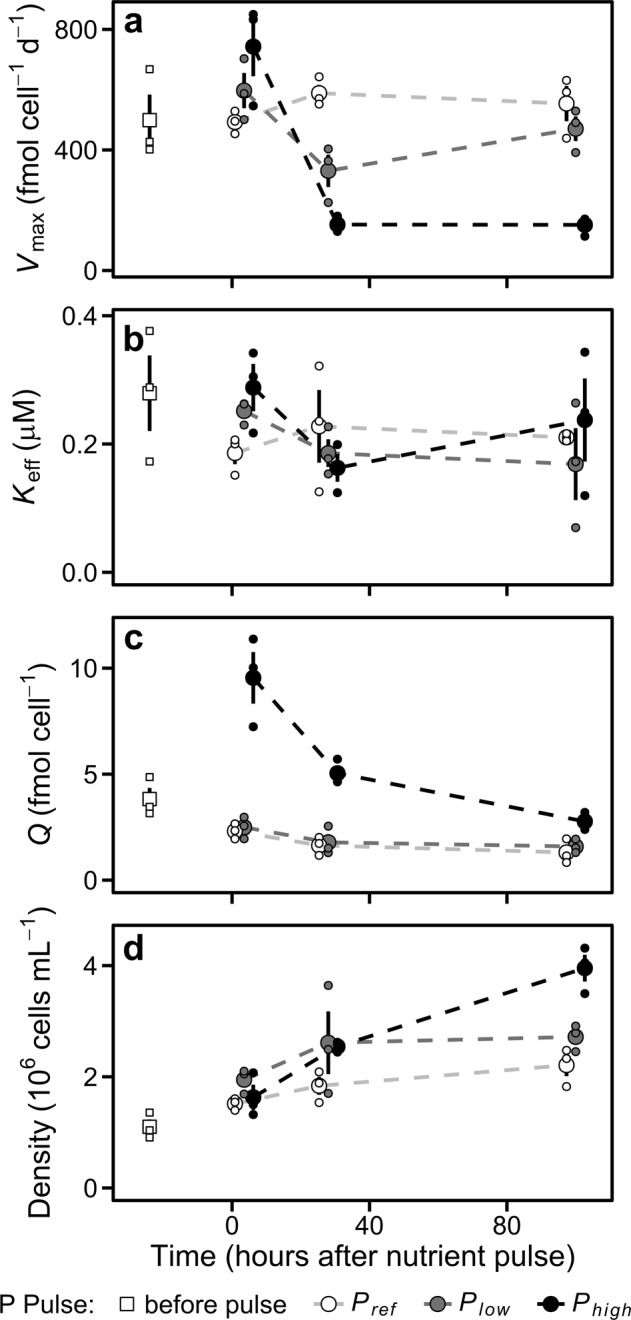
Fig. 1.

Dynamics of the population and cellular traits measured in the different P pulse treatments. a Maximum phosphorus uptake rate (Vmax). b Effective half saturation constant for phosphorus (Keff). c Phosphorus quota. d Cell density. Big dots represent mean values. Small dots are the observations from the three experiments. Error bars show standard error estimated from untransformed data. Dashed lines join mean values. The horizontal position of the dots is slightly adjusted to avoid overlapping
