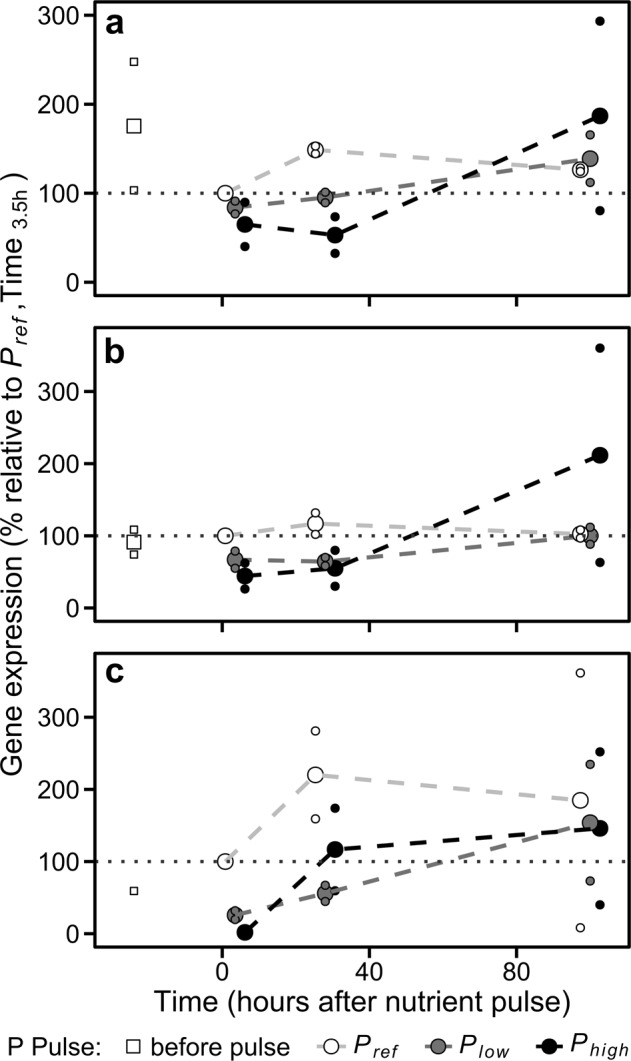
Fig. 3.

Gene expression patterns in the different levels of phosphate addition. a Na/Pi 47666. b Na/Pi 47667. c Pi 39515. Big dots represent mean values. Small dots are the observations from experiments 2 and 3. Dashed lines join mean values. Grey dotted lines point out the reference level (i.e., 100%). The horizontal position of the dots is slightly adjusted to avoid overlapping
