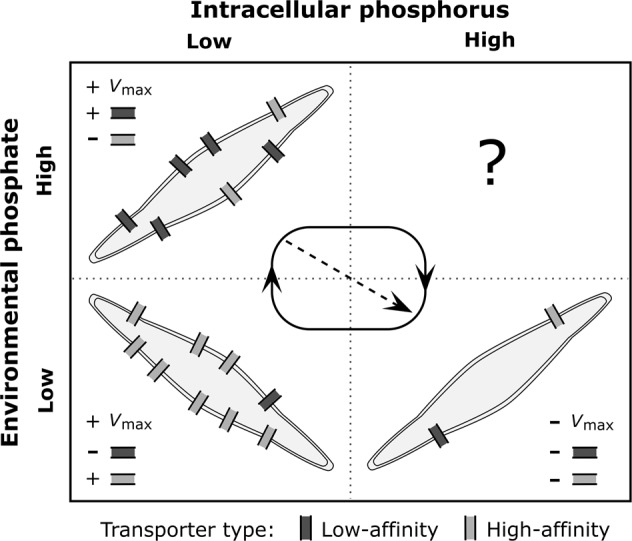
Fig. 4.

Schematic figure representing the stages of phosphate uptake acclimation in P. tricornutum under different nutrient scenarios along the nutrient spatiotemporal gradient. Black arrows indicate the dominant direction of the acclimation succession. The dashed arrow shows the alternative acclimation succession pathway observed in our experiments. The plus sign indicates an increase in trait value or transporter number, whereas minus sign shows a decrease in trait value or transporter number
