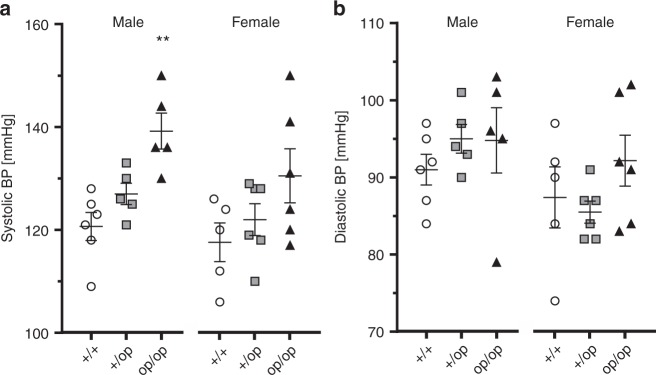
Fig. 7.
Elevated blood pressure in Clcn2op mice. a, b Systolic (a) and diastolic (b) blood pressure (BP) measured by telemetry in Clcn2+/+ (+/+, circles, males: n = 6, females: n = 5), Clcn2+/op (+/op, squares, n = 5 of each sex) and Clcn2op/op mice (op/op, triangles, males: n = 5, females: n = 6) fed with control diet and sub-grouped by sex (males, left; females, right). Single values represent the mean blood pressure of an individual mouse measured over 7 consecutive days. Error bars, mean ± SEM. Statistical significance (analyzed separately by sex and compared to Clcn2+/+) is shown above the groups: **p < 0.01 (Kruskal–Wallis test, Dunn’s multiple comparison test)

