Figure 1.
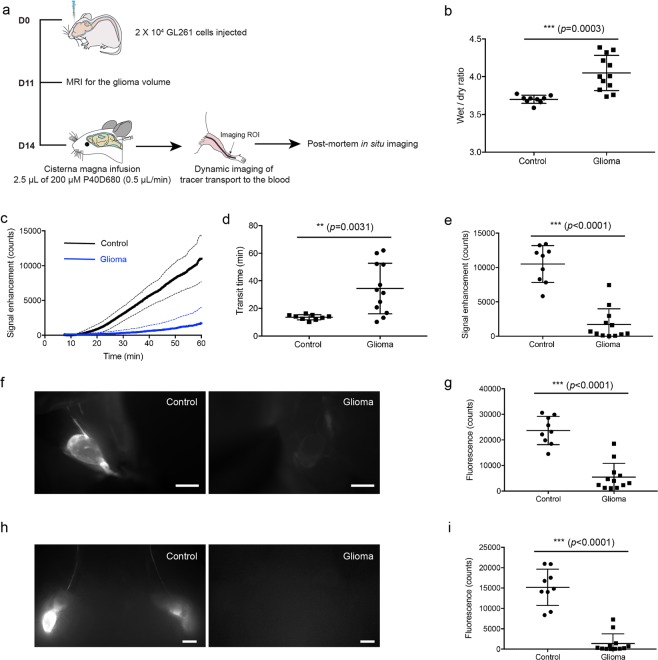
CSF outflow is reduced in glioma-bearing mice. (a) Scheme of experiment timeline. (b) Edema measure (wet/dry ratio) in controls and glioma mice. (c) Saphenous vein signal plot of tracer transport to the systemic blood after cisterna magna infusion of P40D680 (solid line: mean value, dashed line: SD). Control, n = 9; glioma, n = 12. (d) Quantification of transit time to the blood after infusion. Data are the mean± SD. (e) Tracer signal in the blood 60 min after tracer infusion. Data are the mean± SD. (f) Representative images of deep cervical lymph nodes. Scale bar: 1 mm. (g) The mean tracer fluorescent signal of deep cervical lymph nodes 60 min after tracer infusion into lateral ventricle. Data are the mean± SD. (h) Representative images of mandibular lymph nodes. Scale bar: 1 mm. (i) The mean tracer fluorescent signal of mandibular lymph nodes 60 min after tracer infusion into lateral ventricle. Data are the mean± SD.

