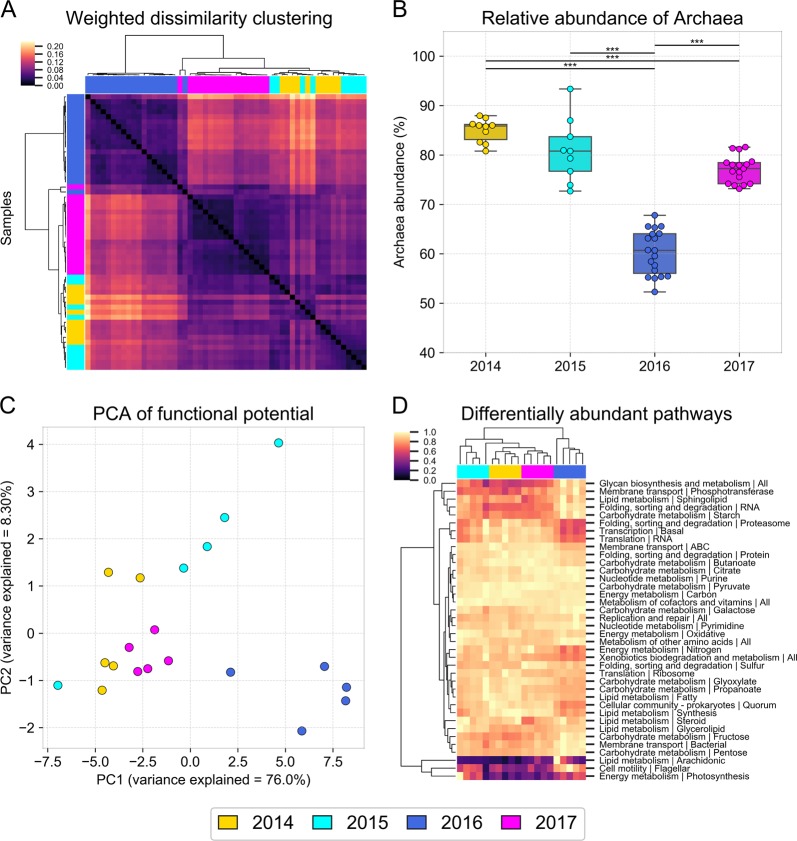
Fig. 2.
Halite microbial community taxonomic composition and functional potential over time. Taxonomic composition of halite microbiomes at each time point, shown by (a) hierarchical clustering (correlation metric) of the Weighted Unifrac dissimilarity matrix and (b) the average relative abundance of archaeal sequences, based on 16S rRNA gene amplicon sequencing. Error bars represent standard deviation; significance bars denote two tail t test p < 0.0001. The changes in functional potential of the halite communities is shown in (c) with a PCA of the abundance of KEGG pathways inferred from WMG co-assembly quantitation and (d) with hierarchical clustering (Euclidean metric) of differentially abundant pathways (ANOVA p < 0.01, FDR=<1%), standardized to the maximum value in each row

