Fig. 3.
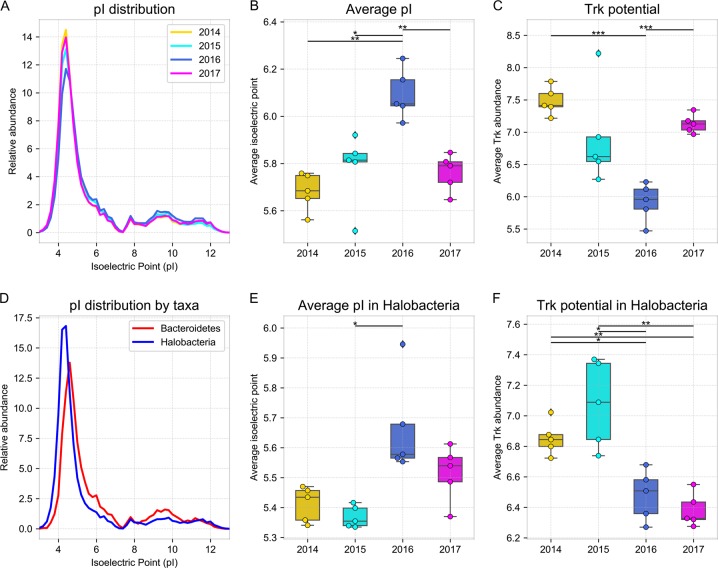
Differences in predicted protein isoelectric points and potassium uptake potential over time. Analysis of the isoelectric points (pI) of proteins encoded in replicates of WMG assemblies from samples harvested at different dates, showing (a) the overall weighted distribution of the protein pIs, and the weighted average pI of proteins encoded in (b) all contigs and (e) only Halobacteria contigs. (d) pI distribution of predicted proteins encoded in Bacteroidetes and Halobacteria contigs. Average potassium uptake potential across time-point samples inferred from trk gene relative abundance and quantified in (c) all contigs and (f) only Halobacteria contigs. Error bars represent standard deviation; significance bars represent group significance based on a two tail t test, and stars denote the p-value thresholds (* = 0.01, ** = 0.001, *** = 0.0001)

