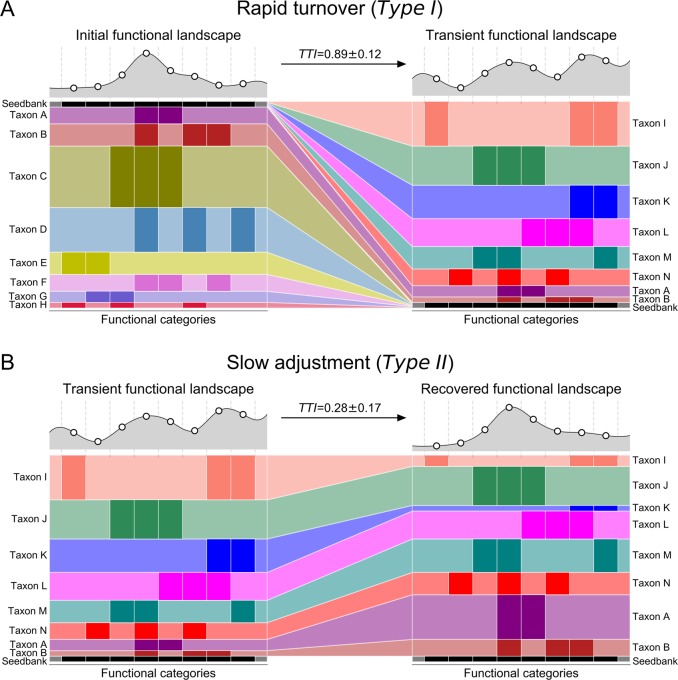
Fig. 5.
Microbial community resilience model. Models of a microbiome adapting its functional potential in response to changing environmental conditions either with (a) a rapid shift of the community’s taxonomic composition resulting from new organisms from the seed bank displacing previously dominant taxa through niche intrusion (as seen in the initial shock from the rainfall), or with (b) a gradual adjustment in relative abundance of major taxa (as seen in the halite community recovery). On the y-axis, the vertical spread represents the abundance of a given taxon (A through H) and on the x-axis, darker colored bars show which functional category is encoded in their genomes. The seed bank (black bars) represents rare taxa in the community. The functional landscape curves at the top of each figure visualize the relative total abundance of each functional category, calculated by adding the abundances of the organisms that carry that function. Taxonomic turnover (TTI) rates were calculated for each model community in (a) and (b)

