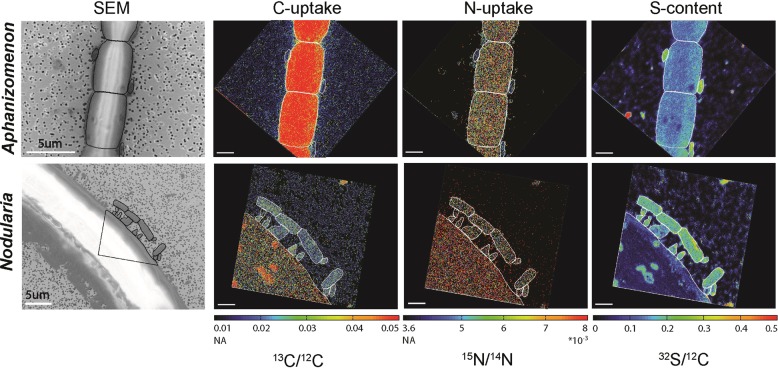
Fig. 4.
Single-cell imaging of Aphanizomenon and Nodularia filaments and their epibionts. Single epibionts were identified using either nanometer-scale secondary ion mass spectroscopy (nanoSIMS) (Aphanizomenon only) or scanning electron microscopy (SEM; Nodularia and Aphanizomenon) and their C and N uptake was subsequently measured using nanoSIMS. C and N uptake are shown as 13C/12C and 15/14N ratios. Cellular sulfur distribution is shown as the 32S/12C ratio which also clearly showed the epibionts. Outlines indicate measured cyanobacterial cells and epibionts. NA = natural abundance. NanoSIMS scale bars are 2 μm. NanoSIMS images are superimposed on a black background box to adjust the image orientation relative to the SEM images

