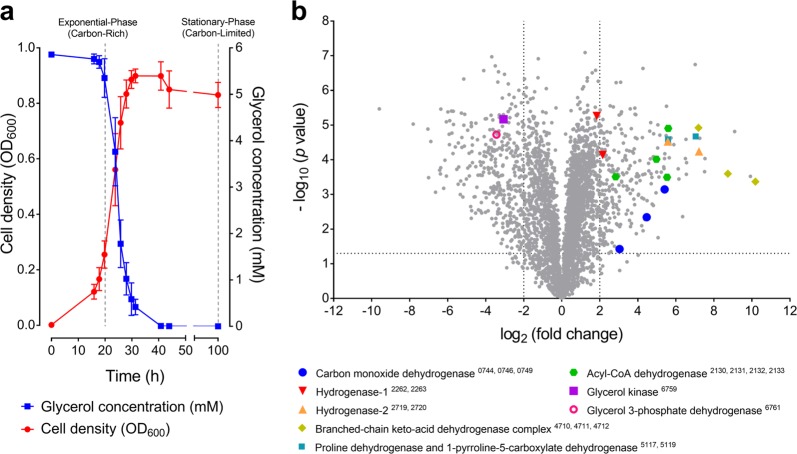
Fig. 1.
Comparison of proteome composition of carbon-replete and carbon-limited cultures of Mycobacterium smegmatis. a Growth of M. smegmatis in Hartmans de Bont minimal medium supplemented with 5.8 mM glycerol. The glycerol concentration of the external medium is shown. Error bars show standard deviations of three biological replicates. Cells were harvested for proteomic analysis at OD600 = 0.25 (mid-exponential phase, glycerol-rich) and 3 days post ODmax (mid-stationary phase, glycerol-limited). b Volcano plot showing relative expression change of genes following carbon limitation. Fold change was determined by dividing the relative abundance of each protein in three stationary phase proteomes with that in the three exponential phase proteomes (biological replicates). Each protein is represented by a gray dot. Structural subunits of selected metabolic enzymes, including the form I CO dehydrogenase, are highlighted and their locus numbers are shown in subscript in the legend

