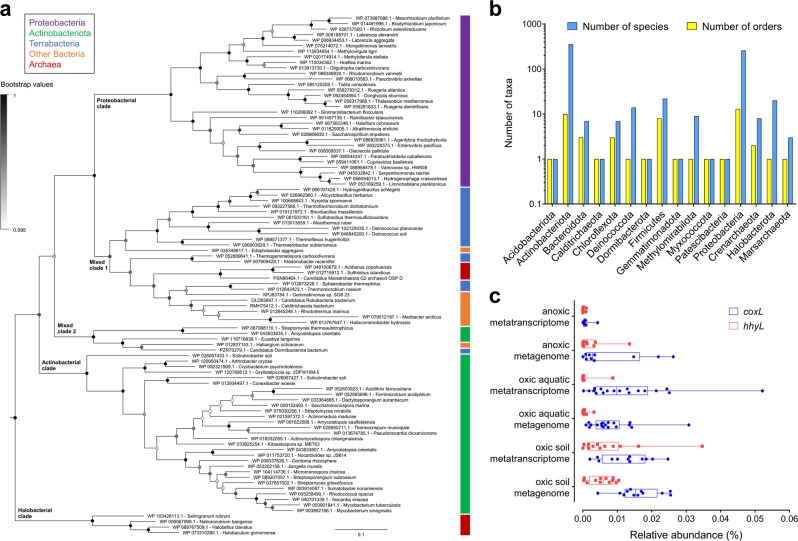
Fig. 4.
Distribution of carbon monoxide dehydrogenases in genomes, metagenomes, and metatranscriptomes. a Maximum-likelihood phylogenetic tree showing the evolutionary history of the catalytic subunit of the form I CO dehydrogenase (CoxL). Evolutionary distances were computed using the Poisson correction model, gaps were treated by partial deletion, and the tree was bootstrapped with 200 replicates. The tree was constructed using a representative subset of 94 CoxL amino acid sequences from Table S3 and a neighbor-joining tree containing all 709 CoxL sequences retrieved in this study is provided in Fig. S2. The major clades of the tree are labeled, and the colored bars represent the phylum that each sequence is affiliated with. The tree was rooted with five form II CO dehydrogenase sequences (not shown). b Phylum-level distribution of the CoxL-encoding species and orders identified in this work. c Abundance of coxL genes and transcripts in environmental samples. In total, 40 pairs of metagenomes and metatranscriptomes (20 aquatic, 20 terrestrial) were analyzed from a wide range of biomes (detailed in Table S5). The abundance of hhyL genes and transcripts, encoding the high-affinity group 1 h [NiFe]-hydrogenase, are shown for comparison. Box plots show the individual values and their mean, quartiles, and range for each dataset

