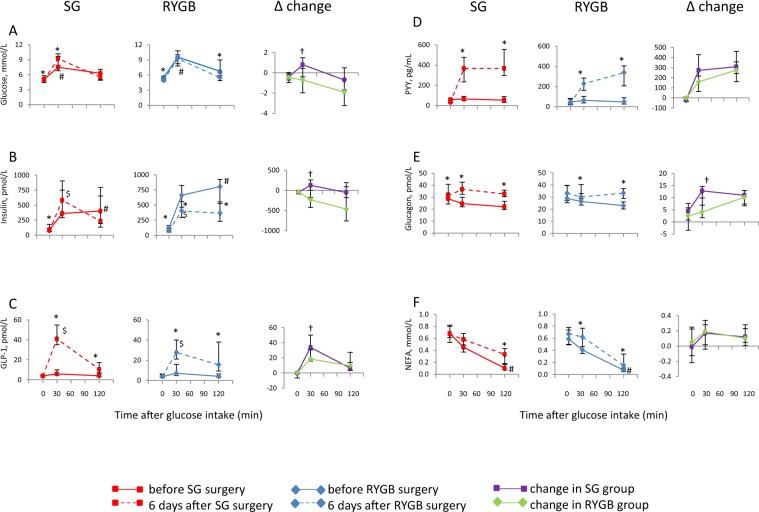
Figure 1.
Measurements of glucose, insulin, GLP-1, PYY, glucagon, and NEFA during an oral glucose tolerance test on the day before and six days after SG or RYGB surgery. Comparisons are made within groups for each type of surgery, and between groups for changes in concentrations from pre- to post surgery. Results are presented for N = 15 in the SG group and N = 16 in the RYGB group. Data are presented as median with 25–75 percentiles. *Within group comparisons at the same time point using Wilcoxon Signed Ranks Test #comparison of SG and RYGB values the day before surgery using Mann-Whitney test $comparison of SG and RYGB values six days after surgery using Mann-Whitney test †comparison of changes within group for SG and RYGB values using Mann-Whitney test P values < 0.05 were considered statistically significant.

