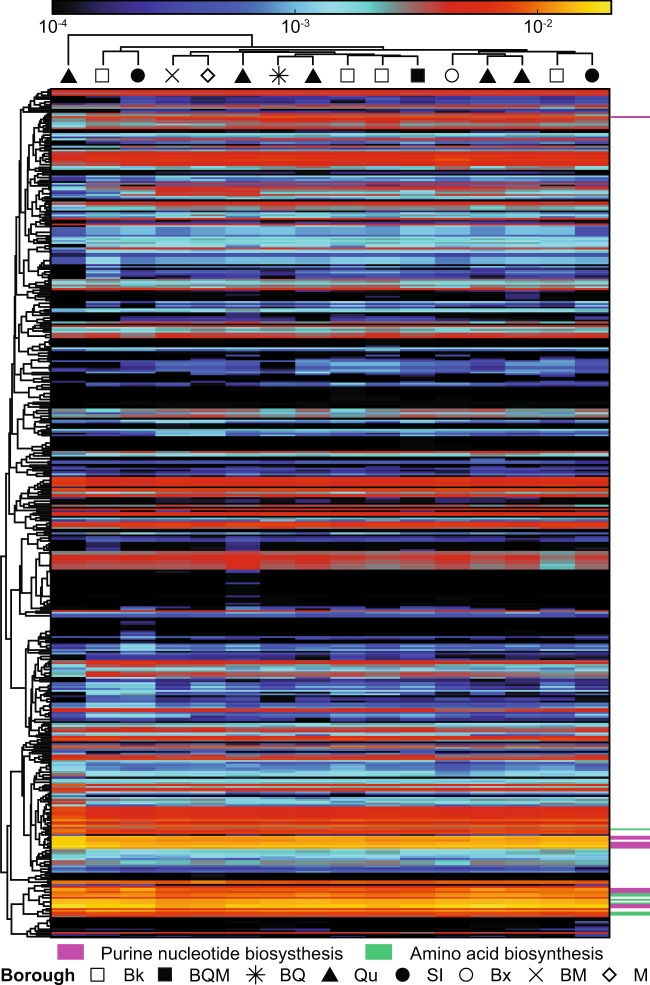
Fig. 4.
MetaCyc pathways inferred from shotgun metagenomic sequence data in November 2014 DEP sewage samples. Rows represent MetaCyc pathways identified with HUMAnN2, columns represent samples, and cells are colored according to the number of sum-normalized reads per kilobase on a log scale. Members of the most abundant pathway classes are indicated by colored bars to the right of the heat map. Shapes represent the borough from which each DEP sample was collected. Abbreviations: Bk = Brooklyn, BQM = Brooklyn/Queens/Manhattan, BQ = Brooklyn/Queens, Qu = Queens, SI = Staten Island, Bx = Bronx, BM = Bronx/Manhattan, M = Manhattan

