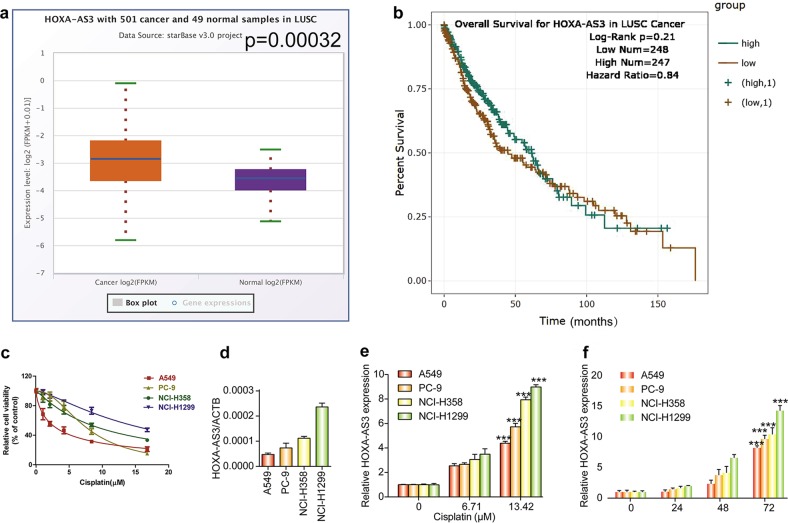
Fig. 1. NSCLC cells display different responses to cisplatin treatment and HOXA-AS3 expression increases with cisplatin treatment.
a The StarBase v 3.0 project was used to analyze the level of HOXA-AS3 in 501 cancer and 49 normal samples in LUSC. b Survival curve used to determine the level of HOXA-AS3 in LUSC. c CCK-8 assay of the viability of NSCLC cell lines treated with increasing concentrations (0, 1.049, 2.097, 4.195, 8.389, 16.779 μM) of cisplatin for 48 h. d qPCR analyses of the HOXA-AS3 basal level in four NSCLC cell lines under the IC50 of cisplatin for 48 h. e qPCR analyses of the HOXA-AS3 expression in NSCLC cell lines with increasing concentrations of cisplatin for 48 h. f qPCR analyses of the HOXA-AS3 expression of NSCLC cell lines under the IC50 of cisplatin at different times. (*p < 0.05, **p < 0.01, ***p < 0.001)

