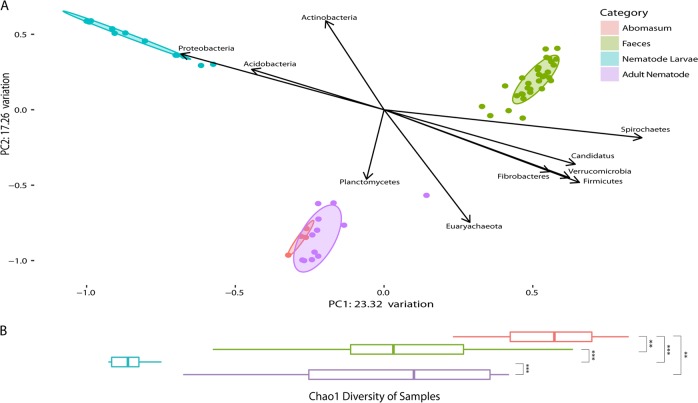
Fig. 4.
Bray–Curtis dissimilarity of the ovine microbiome (abomasal lumen contents and faeces) and nematode microbiome (larval and adult nematodes) correlated with phyla, and Chao1 species richness. a Bray–Curtis dissimilarity of microbiomes studied. For the ‘Abomasum’ samples, each point on the plot is a sample derived from the abomasal washings from one of four lambs, collected 28 days post infection. For the ‘Faeces’ samples, each point on the plot is a sample derived from a stool sample collected from one of four lambs from one of ten time points over a 28-day infection period. For the ‘Nematode Larvae’ samples, each point on the plot is a sample derived from a pooled mixture of ~10,000 larvae, and for the ‘Adult Nematode’ samples, each point on the plot is a sample derived from a pooled mixture of 100 nematodes (five H. contortus (four males, one mixed sex) and seven T. circumcincta (five females, one male, one mixed sex) samples). Ellipses show 80% confidence intervals for their respective groups. The two components of this plot that explained the most variation make up the x- and y-axes. Of the 13 different phyla identified, 10 correlate significantly with one or both of the components of the PCoA based on Spearman’s rank-correlation coefficient. By superimposing this over the PCoA plot, the relationship between these phyla and their environments is visualised. b Horizontal alpha diversity boxplots of microbiomes studied are representative of Chao1 species richness. Significance was determined per the Mann–Whitney U test

