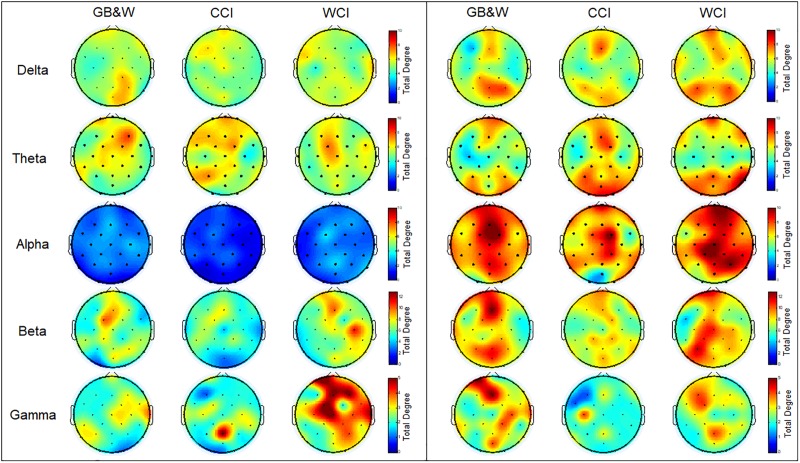
FIGURE 7.
Topological maps of mean total degree (TD): (left) resting-state eyes open, and (right) learning for all three groups (GB&W, CCI, WCI) and frequencies (delta, theta, alpha, beta, and gamma). The color bars of total degree are set to identical ranges per frequency band. Red colors denote high total degree nodes; Blue colors denote low total degree nodes.

