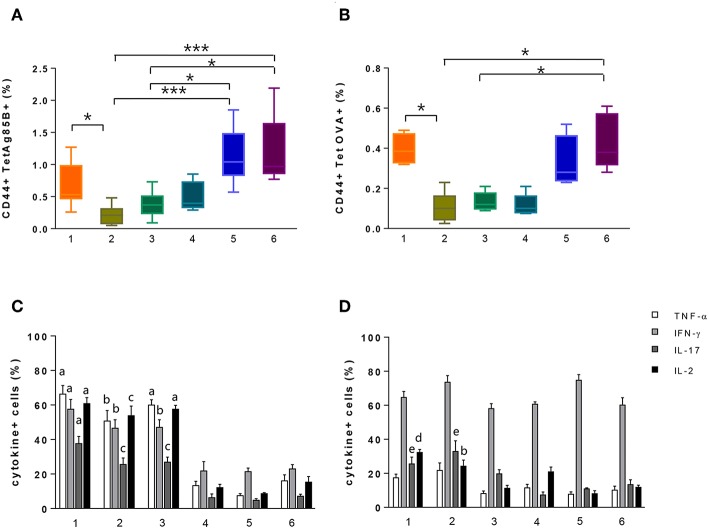
Figure 3.
Identification of tetramer-specific CD4+ T cells and their cytokine production. Tetramer-specific CD4+ T cells and their cytokine production were assessed in splenocytes treated with the different protocols reported in Figure 1. (A,B) Box plots of the frequencies of Tet-Ag85B+ (A) and Tet-OVA+ (B) T cells with respect to CD4+ T cells, detected employing protocols 1–6, as reported in the x axis. Values are reported as mean ± SEM of 10–12 mice, obtained in three independent experiments. Kruskal-Wallis test, followed by Dunn's post-test for multiple comparisons, was used to assess the statistical difference between protocols (*P ≤ 0.05, ***P ≤ 0.001). (C,D) Frequencies of TNF-α-, IFN-γ-, IL-17-, and IL-2-positive cells among Tet-Ag85B+ (C) and Tet-OVA+ (D) cells, employing protocols 1–6, as reported in the x axis. Values are reported as mean ± SEM of 10–12 mice, obtained in three independent experiments. The significant difference between each cytokine among the different protocols, according to the Kruskal-Wallis test, followed by Dunn's posttest for multiple comparisons (P ≤ 0.05), is reported with letters above the error bars; “a” significant difference vs. protocols 4, 5, and 6; “b” vs. protocol 5; “c” vs. protocols 4 and 5; “d” vs. protocols 3, 5, and 6; “e” vs. protocol 4.

