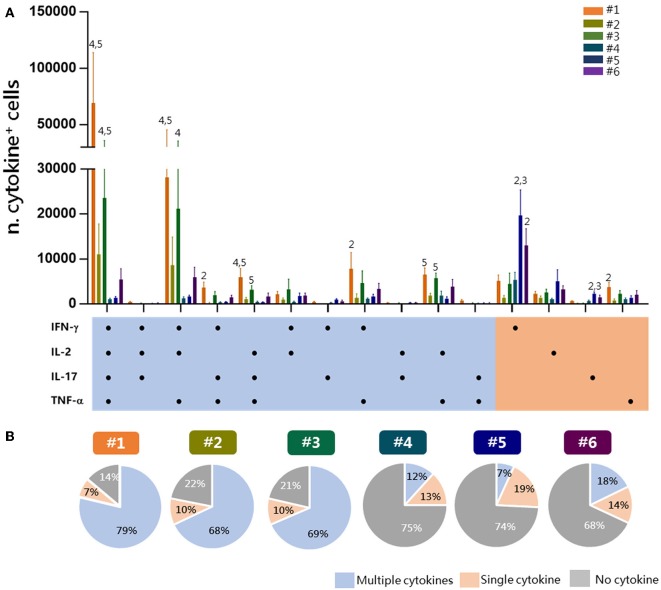
Figure 4.
Multifunctional response of Tet-Ag85B+ T cells. Multifunctional profiles of Tet-Ag85B+ T cells were detected by the different experimental procedures. (A) Histograms represent the number of Tet-Ag85B+ T cells producing different combinations of cytokines shown on the x axis, detected employing the different protocols. Responses are grouped and color coded according to the functionality (orange for single cytokine, light blue for two or more cytokines). Values are reported as mean ± SEM of 10–12 mice, obtained in three independent experiments, and the numbers above the error bars indicate which protocols are significantly different according to the Kruskal-Wallis test, followed by Dunn's posttest for multiple comparisons (P ≤ 0.05). (B) Pie charts of the six protocols, in which each slice of the pie represents the fraction of Tet-Ag85B+ T cells producing two or more cytokines (multiple cytokines, light blue), a single one (orange), or none (gray). Frequencies are reported within each slice.

