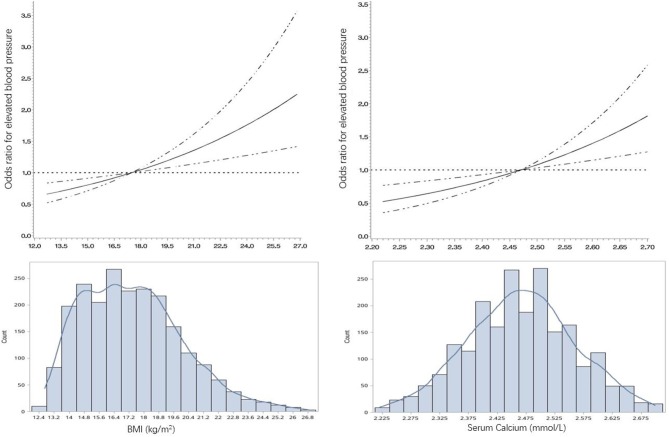
Figure 2.
The restricted cubic spline for the association of BMI and serum calcium with OR of elevated blood pressure in children and adolescents aged 7–18 in China, 2014. BMI, body mass index; OR, odds ratio. The lines represent adjusted odds ratios of elevated blood pressure (EBP, including pre-hypertension and hypertension) based on restricted cubic splines for the level of BMI and serum calcium level in a multivariable-Logistic regression model. Adjusted factors for the association between BMI and EBP were age, sex and geographic regions. Adjusted factors for the association between serum calcium and EBP were age, sex, geographic regions, and BMI. The bars represent histograms of BMI and serum calcium distribution among the total participants.

