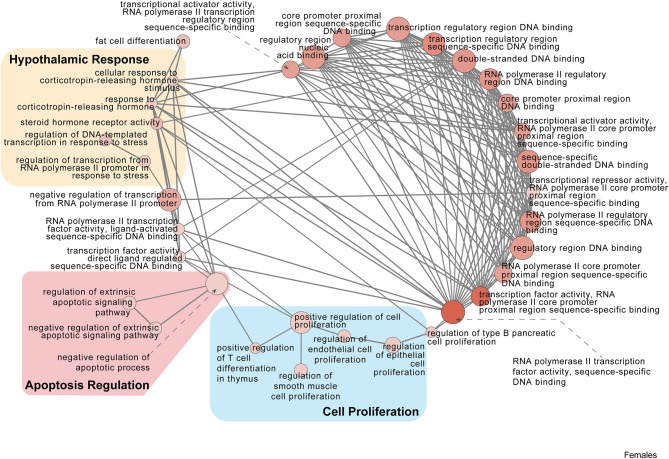
Figure 5.
Female PSD and restraint stress-induced common biological processes. This functional annotation network shows the biological and molecular functions of pathways altered by the combination of PSD and restraint stress when compared to the control groups (no PSD, no restraint). The node size reflects the size of the gene set (i.e., the number of DEGs in that GO term) altered by each treatment. Node color is continuously shaded based on the term significance level [as –log10(p-value)]. Edges are created based on overlap of the genes contained in the terms. Edge width is continuously scaled based on the edge weight (i.e., the strength of the overlap between the genes in two gene sets). The genes used to generate these figures were first selected in an unbiased fashion by the DEG analysis and then subsequently selected based on uncovered GO/pathway analysis.

