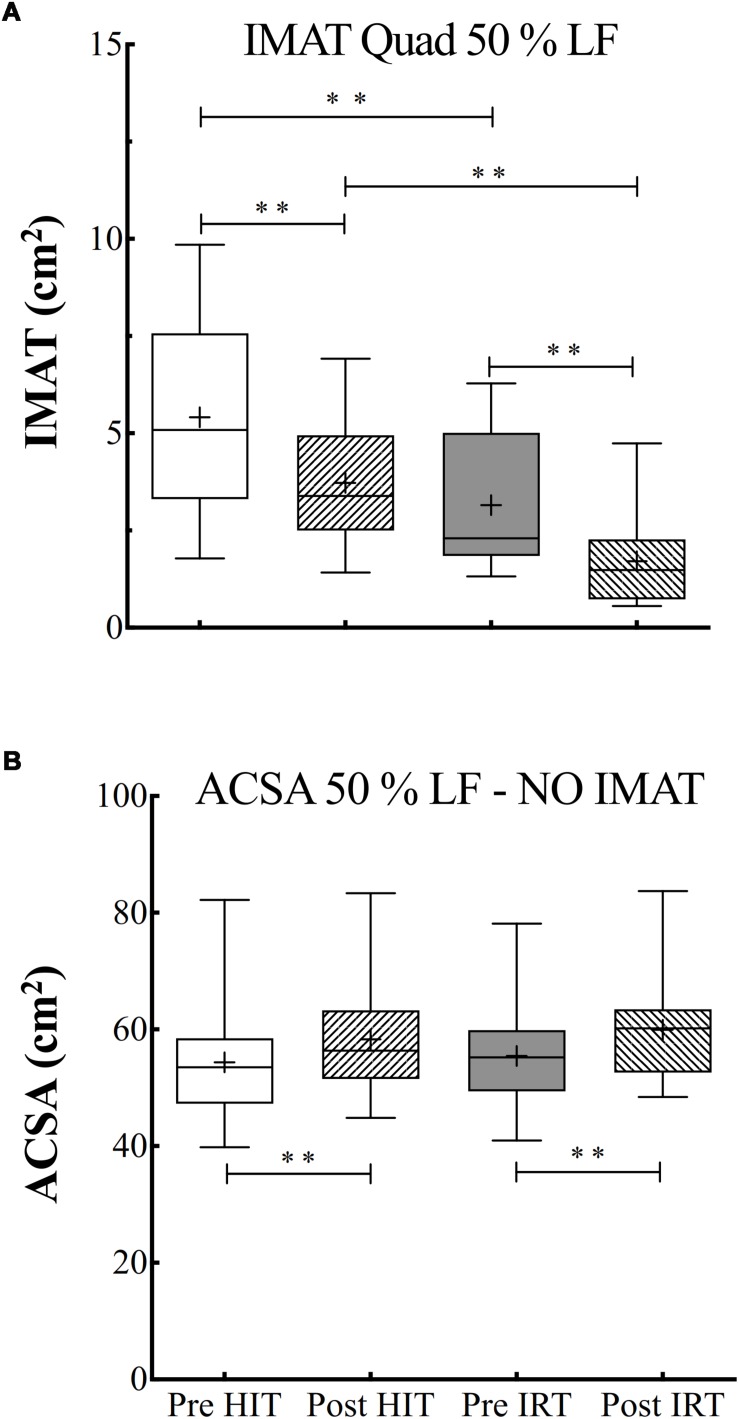
FIGURE 3.
(A) Box and whiskers plots of intermuscular adipose tissue (IMAT, cm2). (B) Box and whiskers plots of ACSA (cm2) measured at 50% of the length between the greater trochanter to the upper border of the patella (% LF) excluding IMAT. Lines and asterisks indicate the significant differences between the mean values (∗∗P < 0.01). The box extends from the 25th to 75th percentiles. The line in the middle of the box is plotted at the median and “+” at the mean. Whiskers range from a Min to Max value.

