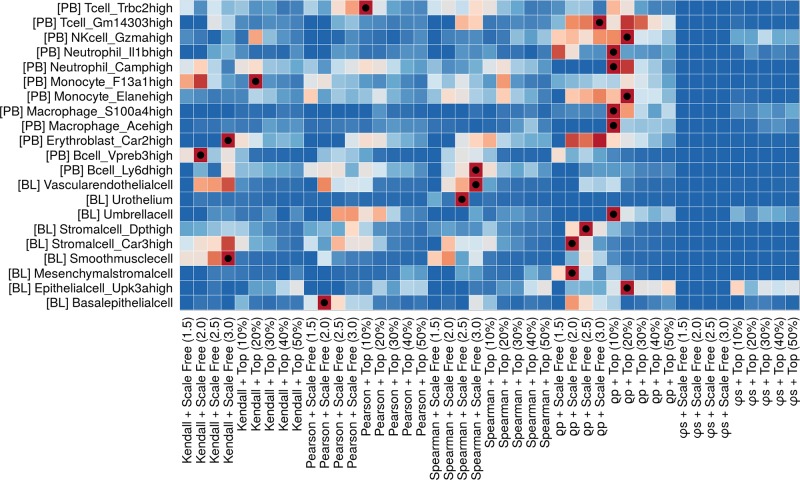
Figure 2.
Ranking of all the network extraction approaches (coexpression metric combined with thinning technique) applied to the different cell types, based on affinity score (AS). The heatmap colors depend on the per-row rescaled −log (P-value) (blue to red). The best method per cell type is marked with a dot. Although some methods seem to fit many cell types a clear cut, one-size-fit-all solution does not emerge. The users can therefore tailor the network extraction method to the different cell types in his/her data.

